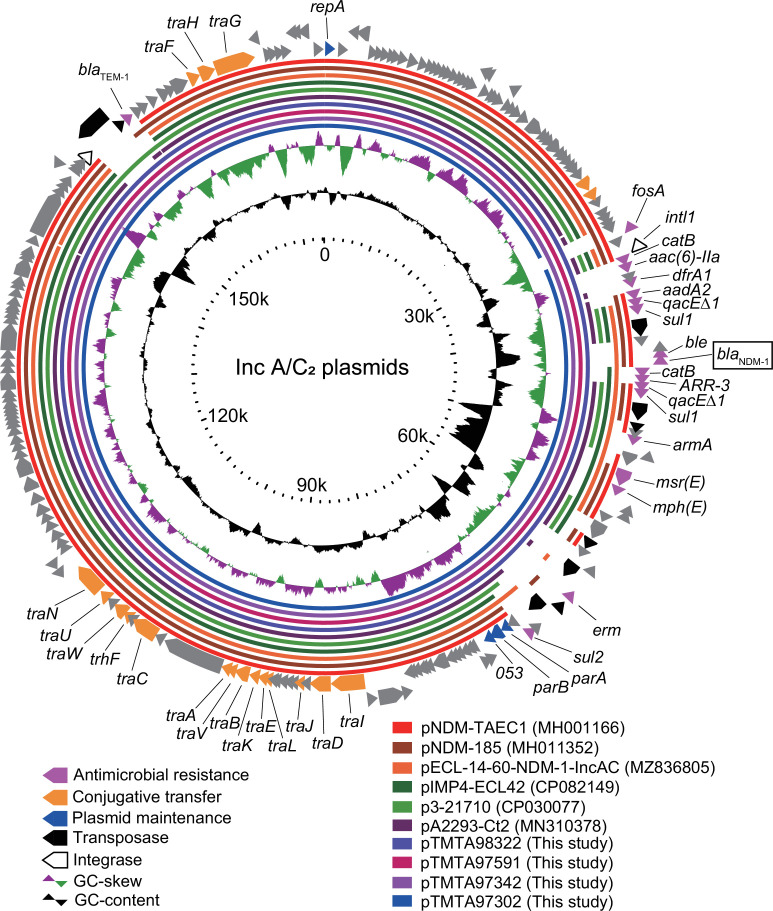
Fig 2.
Circular map of the pTMTA97342 plasmid. IncA/C2 plasmids were compared and visualized using the GView Server (27). Alignment length and percentage of identity cutoff values for sequence-based BLASTn analysis revealed that the colored bars for these plasmids were 80% and 100%, respectively. The positions of open reading frames were derived from those in pTMTA98742, except for repA, which was derived from pNDM-TAEC1.

