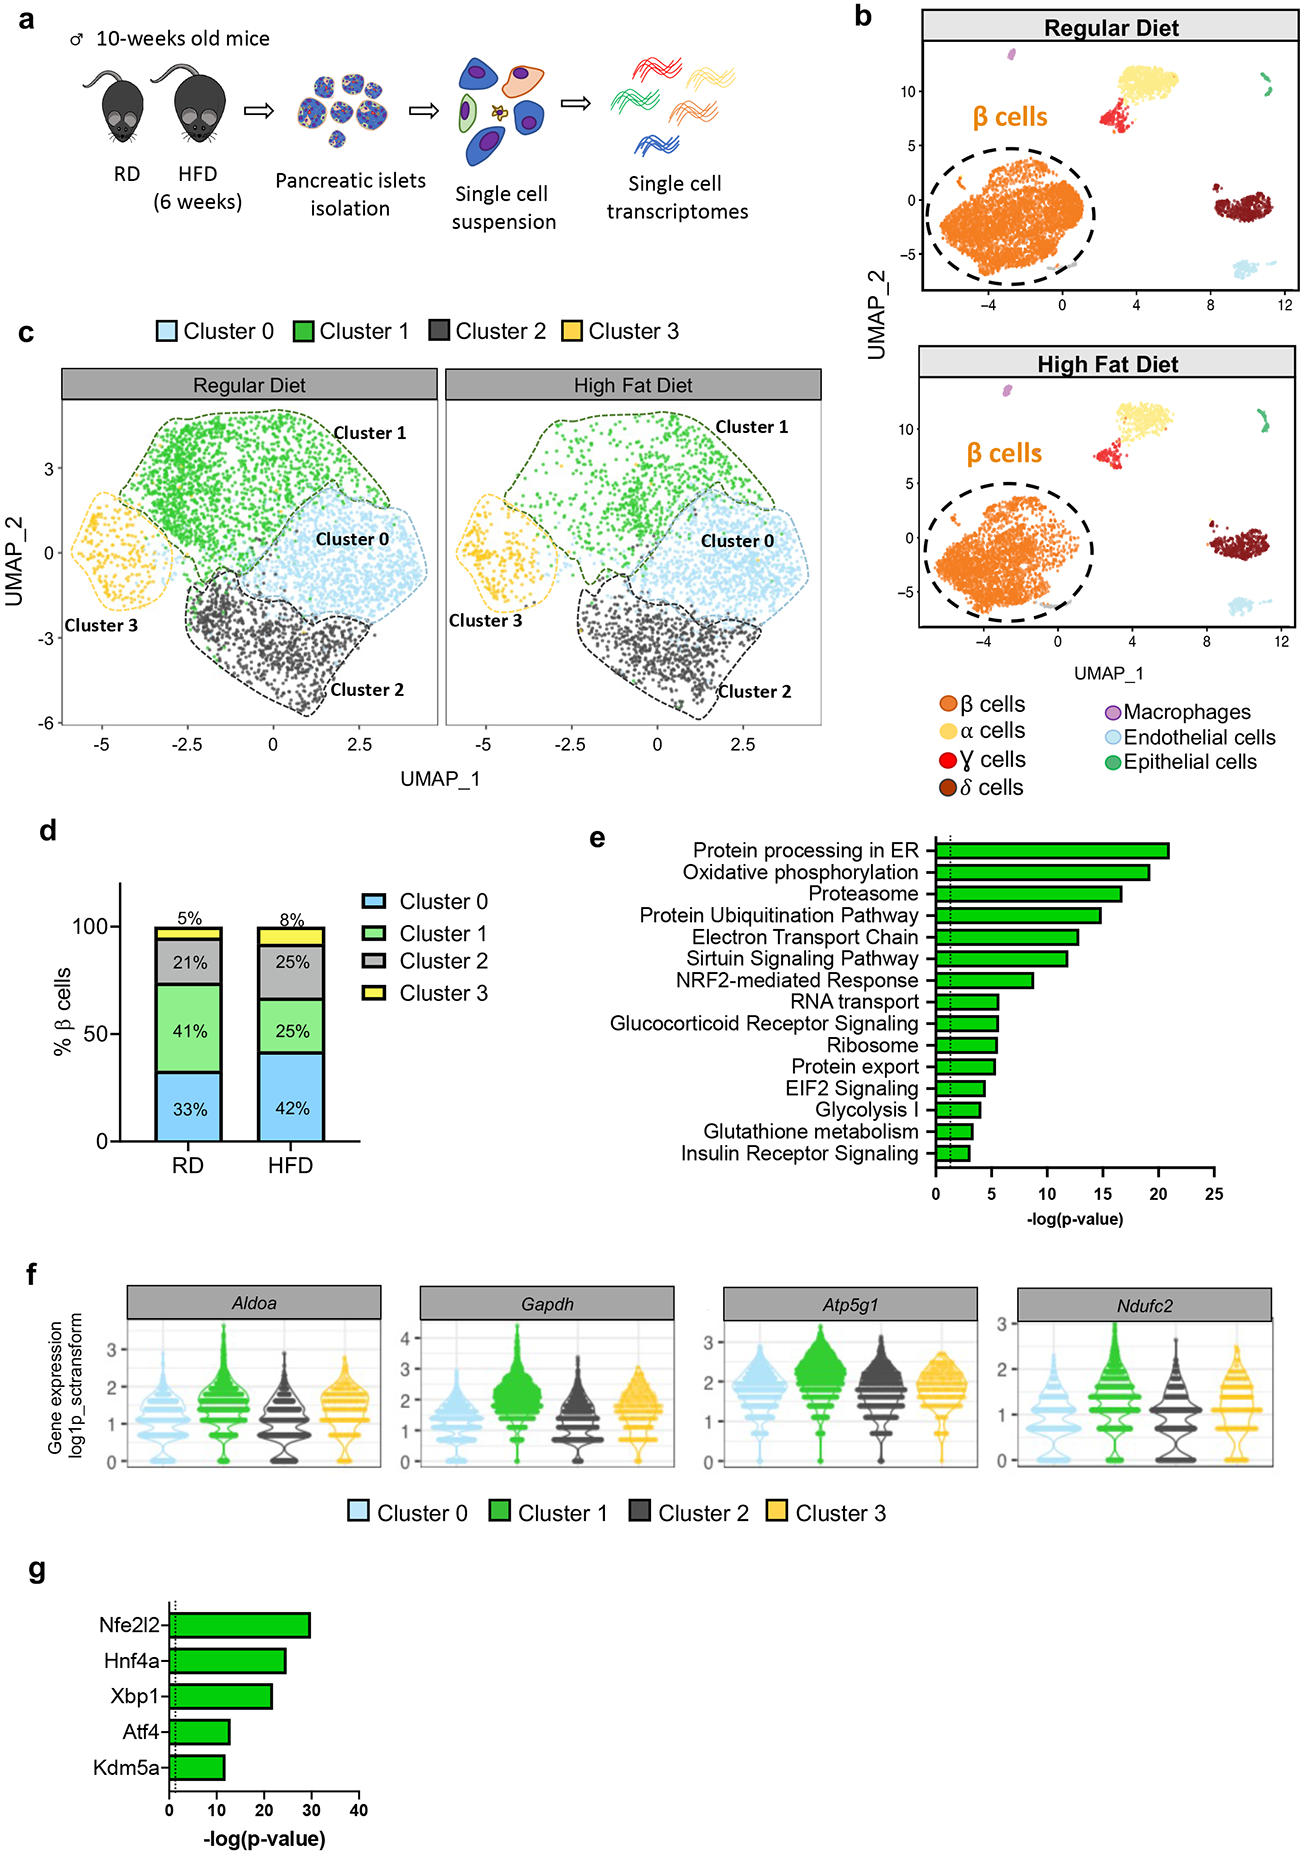
Figure 1. scRNA-seq analysis reveals changes in β cell heterogeneity promoted by diet-induced obesity.

a, Schematic representation of the workflow used for single cell RNA-sequencing (scRNA-Seq) of pancreatic islet cells. b, Unsupervised clustering of single cell transcriptome visualized with uniform manifold approximation and projection (UMAP) analysis. Data represent pancreatic islet cells (N=10,582) from mice fed with Regular Diet (RD, N=6,284 cells pooled from 4 mice) or High Fat Diet (HFD, N=4,298 cells pooled from 5 mice) for 6 weeks after weaning. Annotated cell types are assigned based on known marker gene expression. c, Projection of β cells (N=7,564) from both RD and 6-weeks HFD-fed mice using UMAP analysis. β cell groups are defined according to kNN-based clusters. d, Distribution of β cell clusters in RD- and HFD-fed mice. e, Pathway enrichment analysis of differentially expressed genes in Cluster 1 β cells (p-value was calculated using two-tailed Benjamini-Hochberg). f, Violin plots representing the expression levels (log2(TPM+1)) of genes involved in glycolysis (Aldoa and Gapdh) and electron transport chain (Atp5g1 and Ndufc2) in each β cell cluster. g, Top 5 most statistically significant predicted transcription factors in Cluster 1 β cells (p-value was calculated using two-tailed Benjamini-Hochberg). Source numerical data are available in source data.
