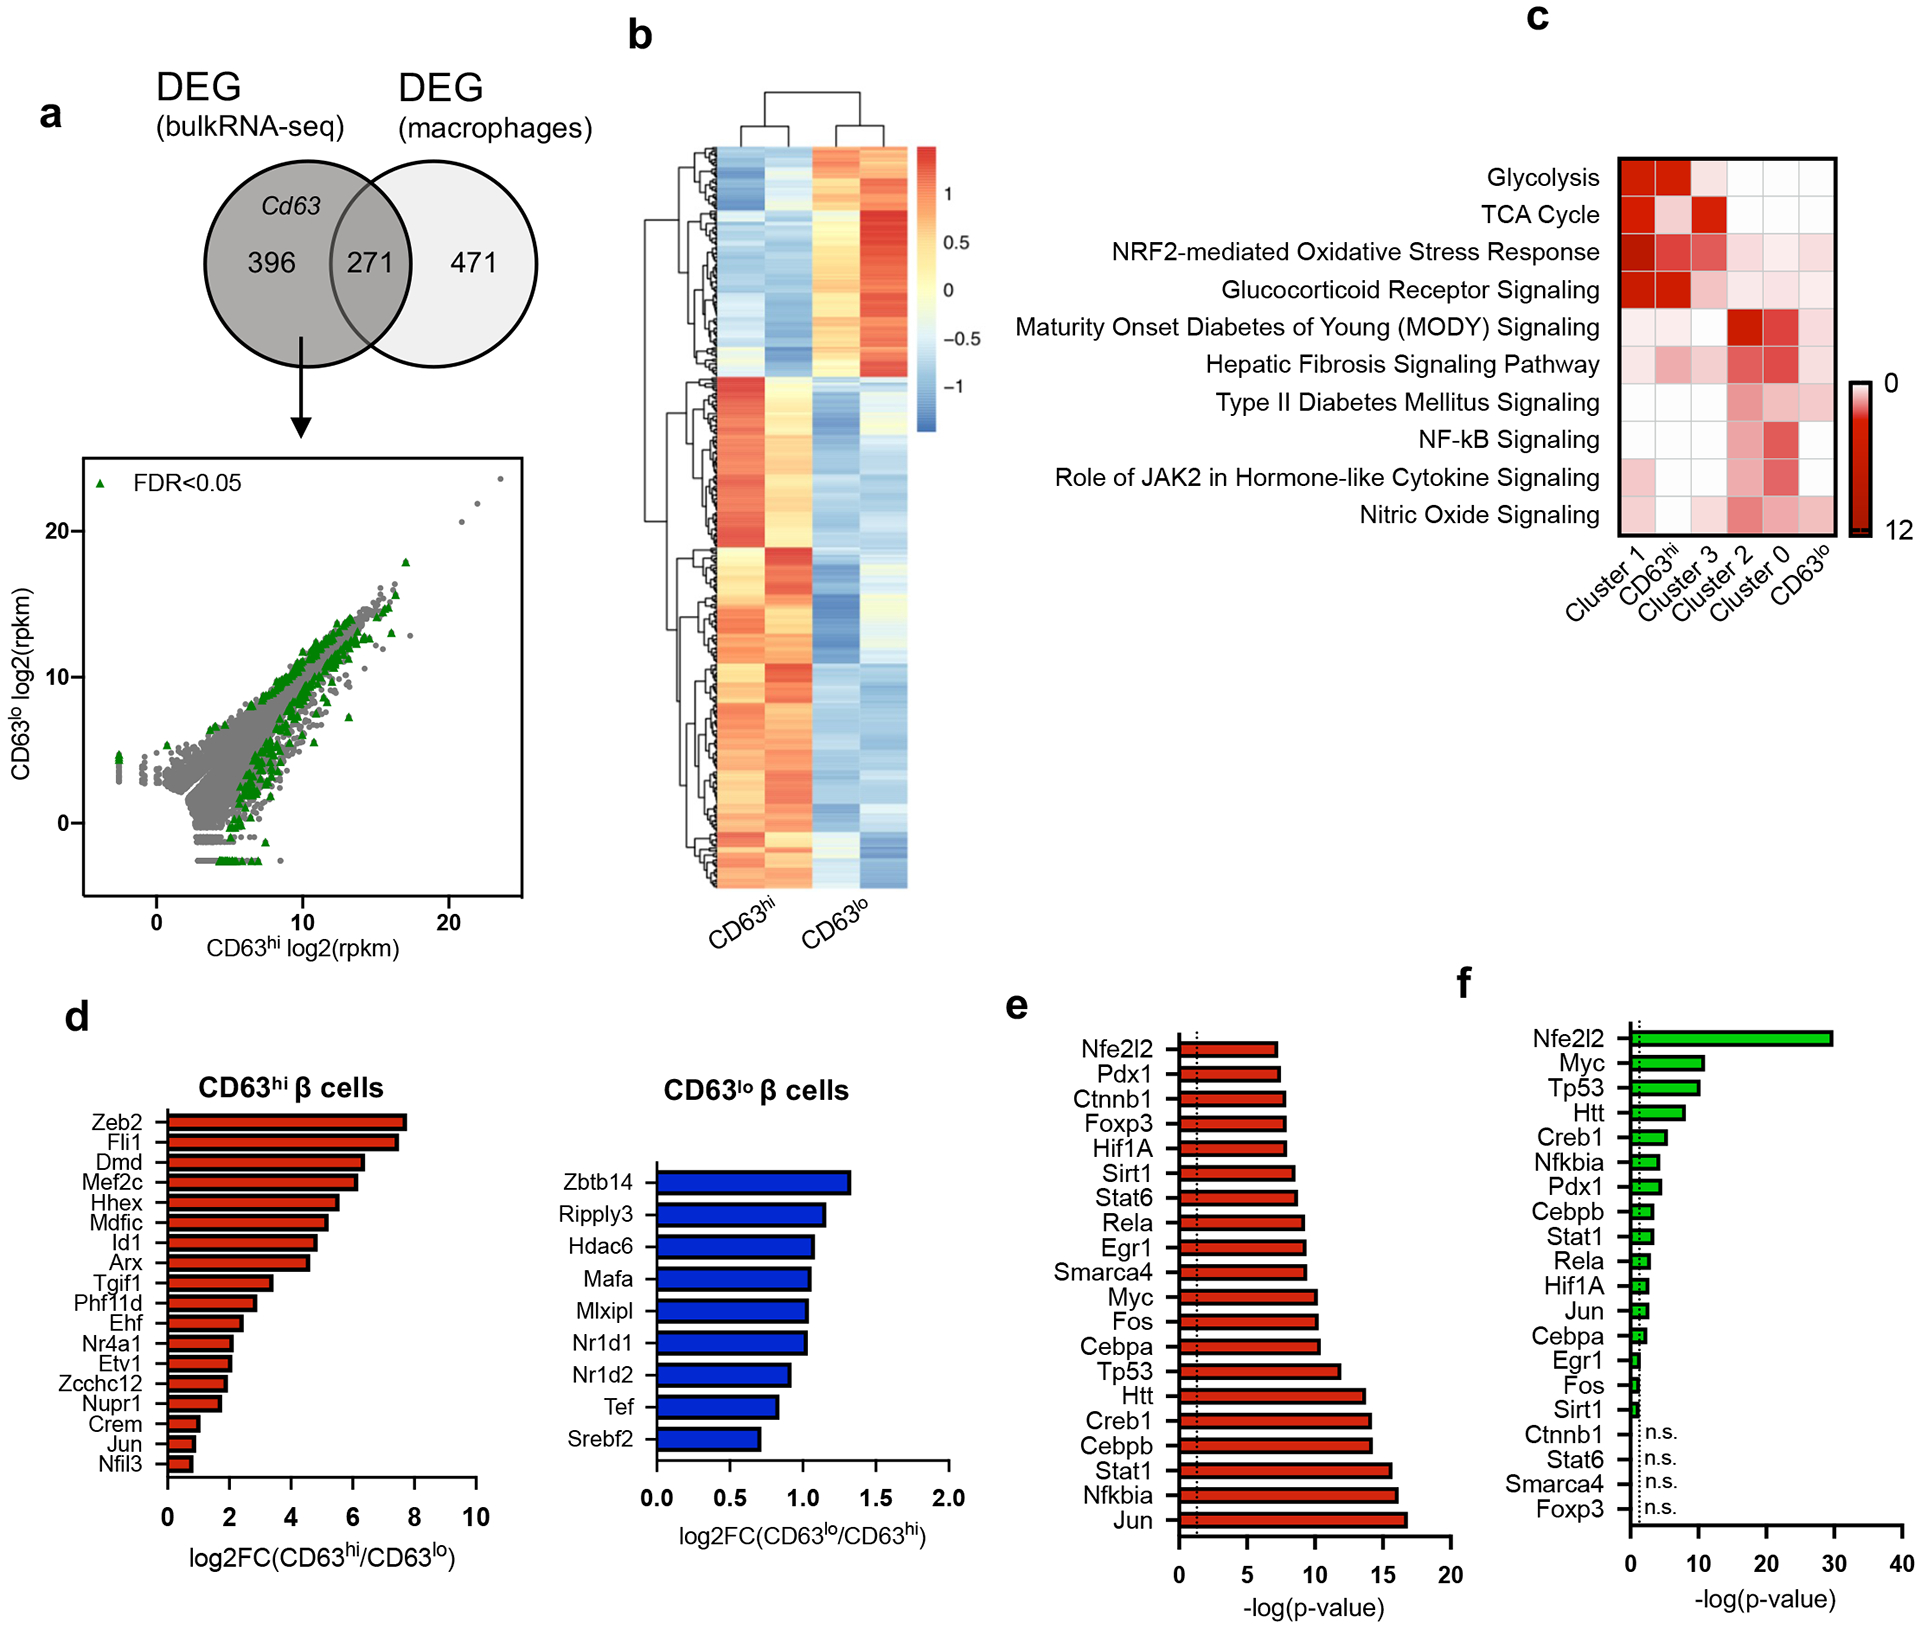
Extended Data Figure 4. Molecular characterization of CD63hi β cells.

a, Venn diagram illustrating the overlap of differentially expressed genes (DEGs) obtained by bulk RNA-Seq and genes enriched in macrophages (left panel). Scatterplot of RNA-Seq analysis from FAC-sorted CD63hi and CD63lo β cells. DEGs with a false discovery rate (FDR) < 0.05 are in green and those that are not differentially expressed are in grey (right panel). b, Heatmap of 396 DEGs from FAC-sorted CD63hi and CD63lo β cells obtained through bulk RNA-Seq. (N = 2, each replicate is pooled from 5 mice). c, Heatmap showing the enriched pathways in β cell clusters 0-3 and CD63hi and CD63lo β cells. d, Differentially expressed transcription factors (DETs) in both CD63hi and CD63lo β cells (p-value was calculated using two-tailed Benjamini-Hochberg). e, Top 20 transcription factors predicted by upstream pathway analysis in CD63hi β cells ordered by statistical significance (p-value was calculated using two-tailed Benjamini-Hochberg). f, Statistical significance of the predicted transcription factors from CD63hi β cells (e) in Cluster 1 β cells (p-value was calculated using two-tailed Benjamini-Hochberg). Source numerical data are available in source data.
