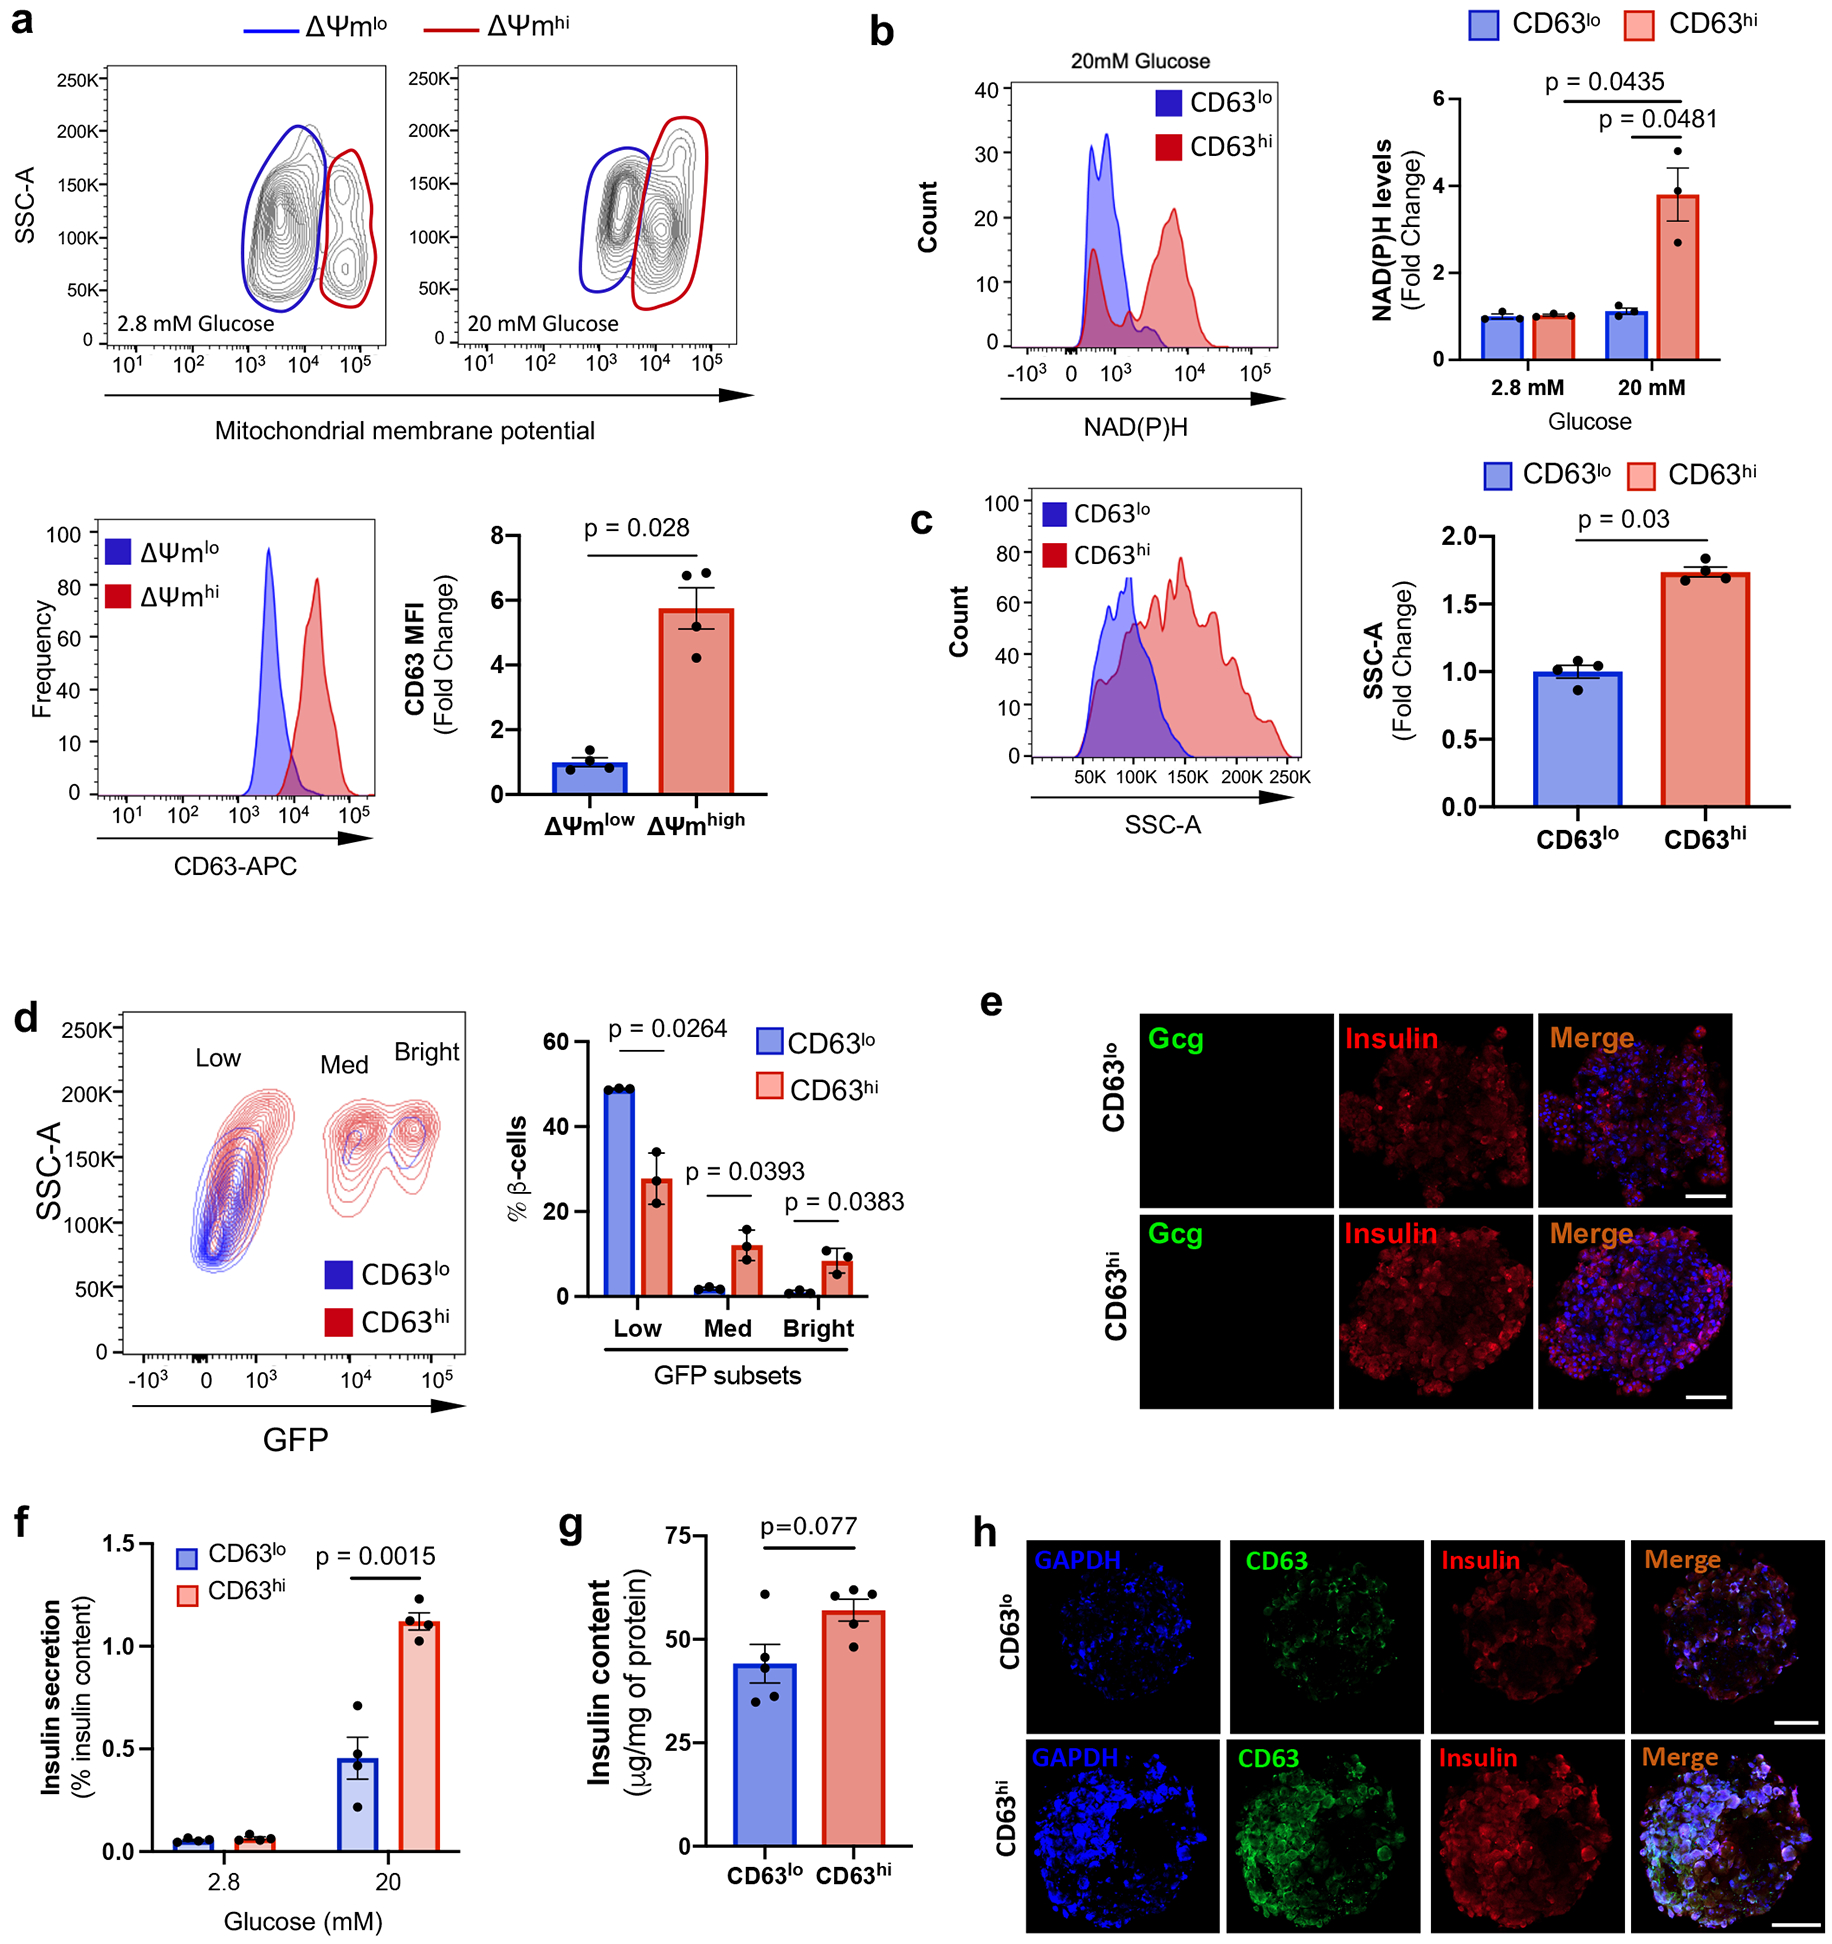
Extended Data Figure 6. Functional analysis of CD63hi β cells.

a, Contour plots of mitochondrial membrane potential in β cells incubated with 2.8 or 20 mM glucose. Histogram and quantification of CD63 expression in β cells with low and high mitochondrial membrane potential after incubation with 20 mM glucose. Results are representative of 4 independent experiments. Data are presented as mean ± S.E.M. Paired two-tailed t test is used for comparison. b, NAD(P)H fluorescent patterns of CD63hi and CD63lo β cells after incubation with 20 mM glucose. Quantification of NAD(P)H levels after incubation with 2.8 or 20 mM glucose (N = 3 independent experiments per group). Paired two-tailed t test is used for comparison. c, Analysis and quantification of cellular granularity in CD63hi and CD63lo β cells assessed by side scatter (SSC). (N = 4 independent experiments per group). Paired two-tailed t test is used for comparison. d, Scatterplots and quantification showing the distribution of CD63hi and CD63lo β cells in the different subpopulations of mouse insulin promoter-GFP transgenic β cells (N = 3 independent experiments per group; 5 mice per experiment). Welch’s unpaired two-tailed t test is used for comparison. e, Representative immunofluorescence images of pseudo-islets from mice showing β cells (Insulin, Red) and α cells (Glucagon, Green) (Scale bars, 50 μm). N = 5 pseudo-islets per group.. f, Static glucose-stimulated insulin secretion (GSIS) assay normalized by insulin content in CD63hi and CD63lo murine pseudo-islets. Data are pooled from 4 independent experiments. Paired two-tailed t test is used for comparison. g, Insulin content of CD63hi and CD63lo murine pseudo-islets normalized by intracellular protein (N = 5 independent experiments per group). Paired two-tailed t test is used for comparison. h, Representative immunofluorescence images of murine pseudo-islets showing Insulin (Red), CD63 (Green) and GADPH (Blue) (Scale bars, 50 μm). N = 5 pseudo-islets per group. Data are presented as mean ± S.E.M. Source numerical data are available in source data.
