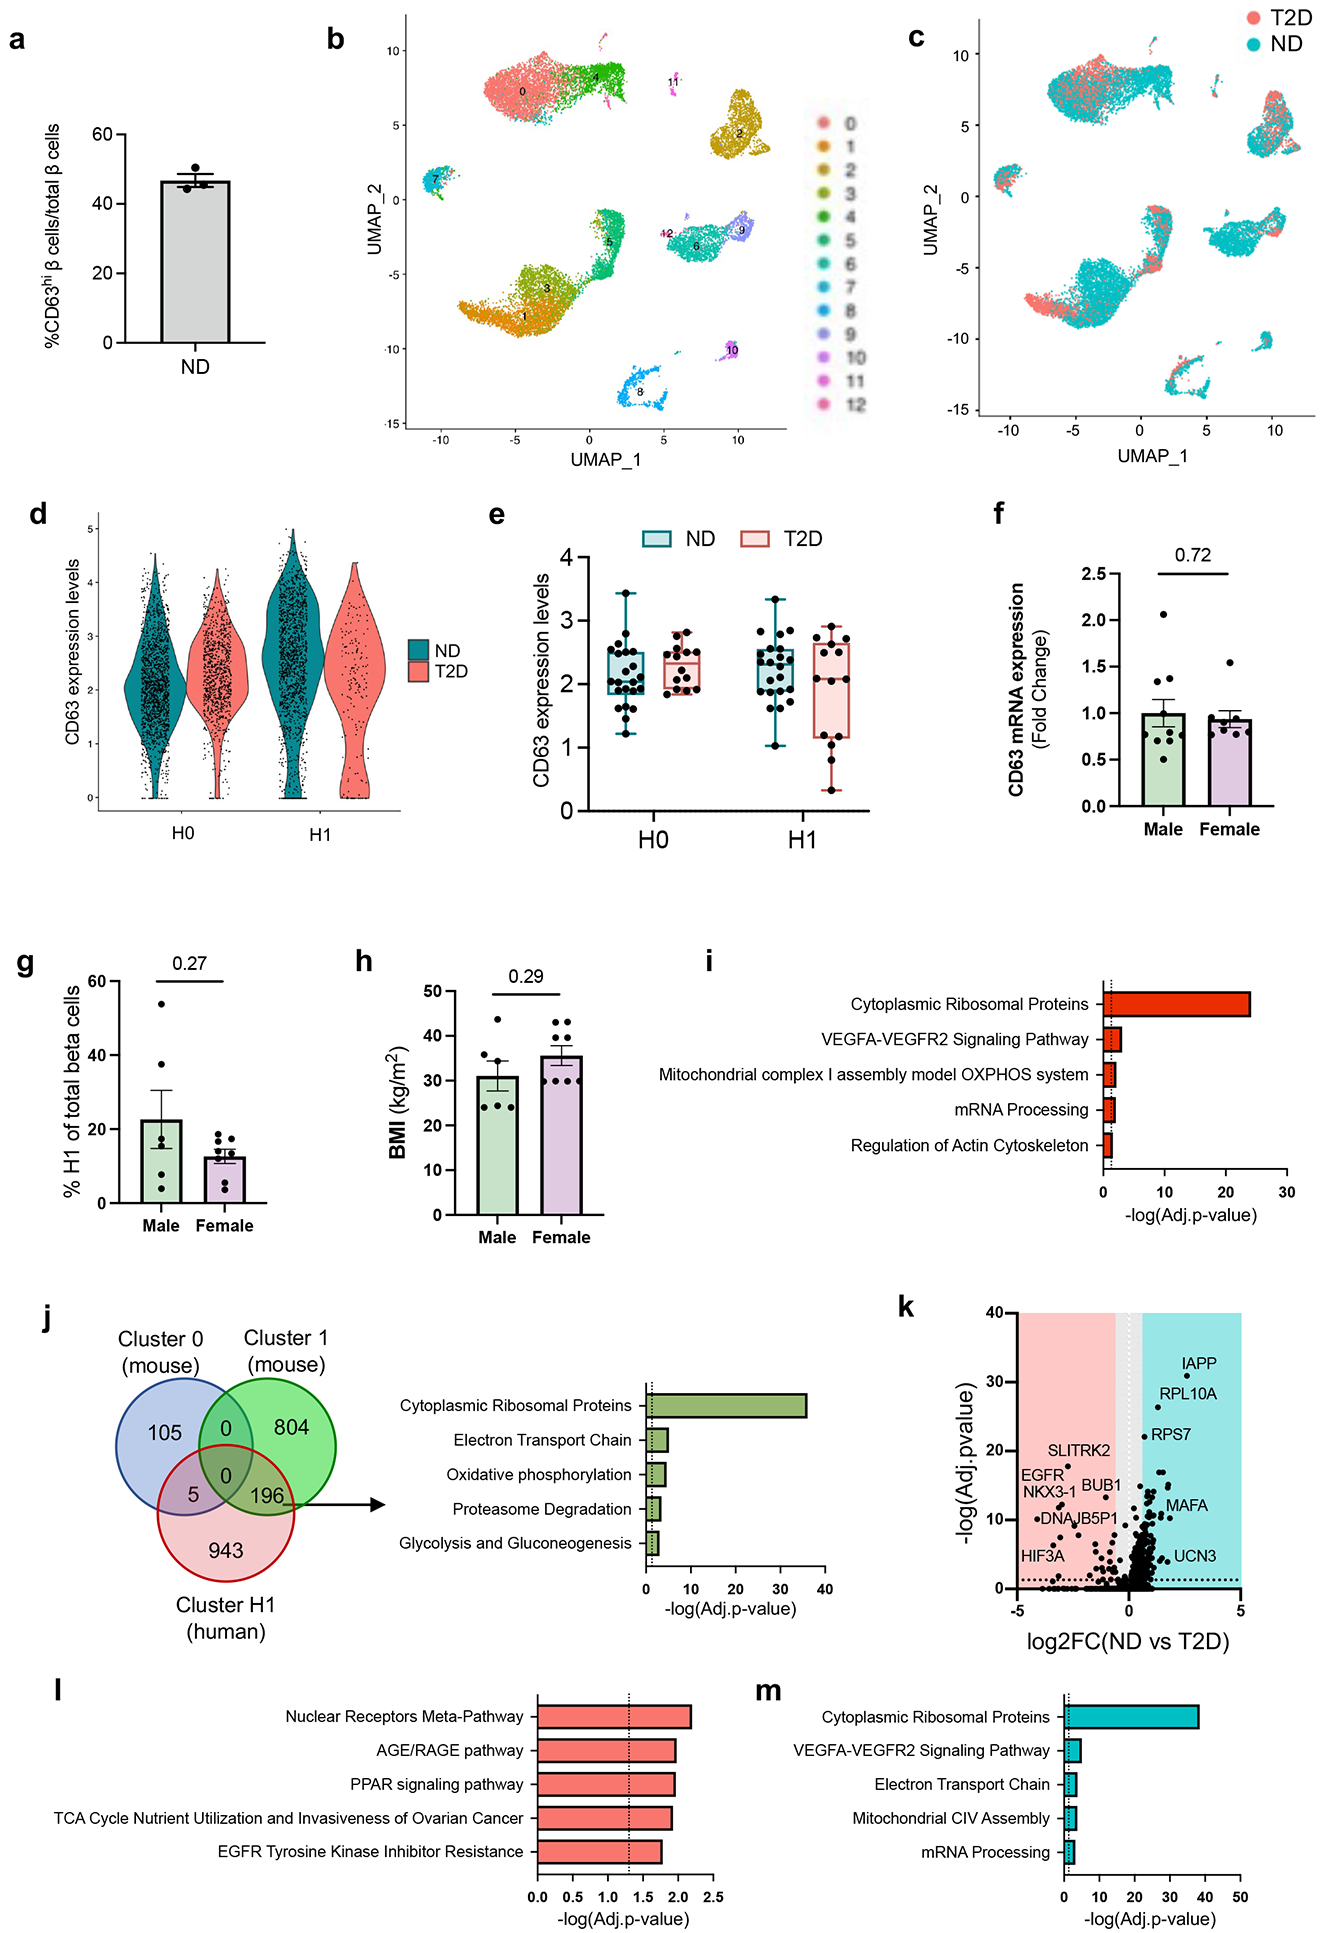
Extended Data Figure 8. Molecular analysis of human CD63hi β cells.

a, Quantification of the percentage of human β cells that are CD63hi (Fig. 3a). N = 3 non-diabetic human donors. Data are presented as mean ± S.E.M. b, UMAP showing the clustering of cells by constructing a Shared Nearest Neighbor (SNN) graph with resolution of 0.5 integrating cells from non-diabetic (ND) and donors with type 2 diabetes (T2D). c, UMAP indicating cells from ND and T2D donors in Extended Data Fig. 8a. d, Violin plots showing CD63 expression in H0 and H1 β cell subclusters in ND and T2D. e, Box plots showing the pseudo bulked median expression levels of CD63 in H0 and H1 β cell subclusters from ND (N=22) and T2D (N=14) donors. Each dot represents the median expression of one donor. Boxes represent the first and third quartiles, center line denotes the median and whiskers showed the maximum and minimum value. f, CD63 mRNA expression in whole islets from male (N=10) and female (N=8) ND donors determined by RT-qPCR. g-h, Frequency of Cluster H1 cells (g) and body mass index (BMI) (h) in T2D donors by sex. Donors with at least 13 β cells are included in the analysis. Male (N=6), Female (N=8). i, Pathway enrichment analysis of differentially expressed genes (DEGs) in human Cluster H1 β cells. j, Venn diagram illustrating the overlap of DEGs (FDR<0.01) among Cluster 0 and 1 mouse β cells obtained by scRNA-Seq and human H1 subcluster. Pathway enrichment analysis of DEGs by scRNA-Seq in Cluster 1 mouse and human H1 β cells. k, Volcano plot showing DEGs in H1 β cells between T2D and ND donors. l, Pathway enrichment analysis of DEGs in H1 β cells from T2D donors. m, Pathway enrichment analysis of DEGs in H1 β cells from ND donors. Data are presented as mean ± S.E.M. and Welch’s unpaired two-tailed t test is used for comparison (f, g, and h), and p-values were calculated using two-tailed Benjamini-Hochberg in I, j, l and m. Source numerical data are available in source data.
