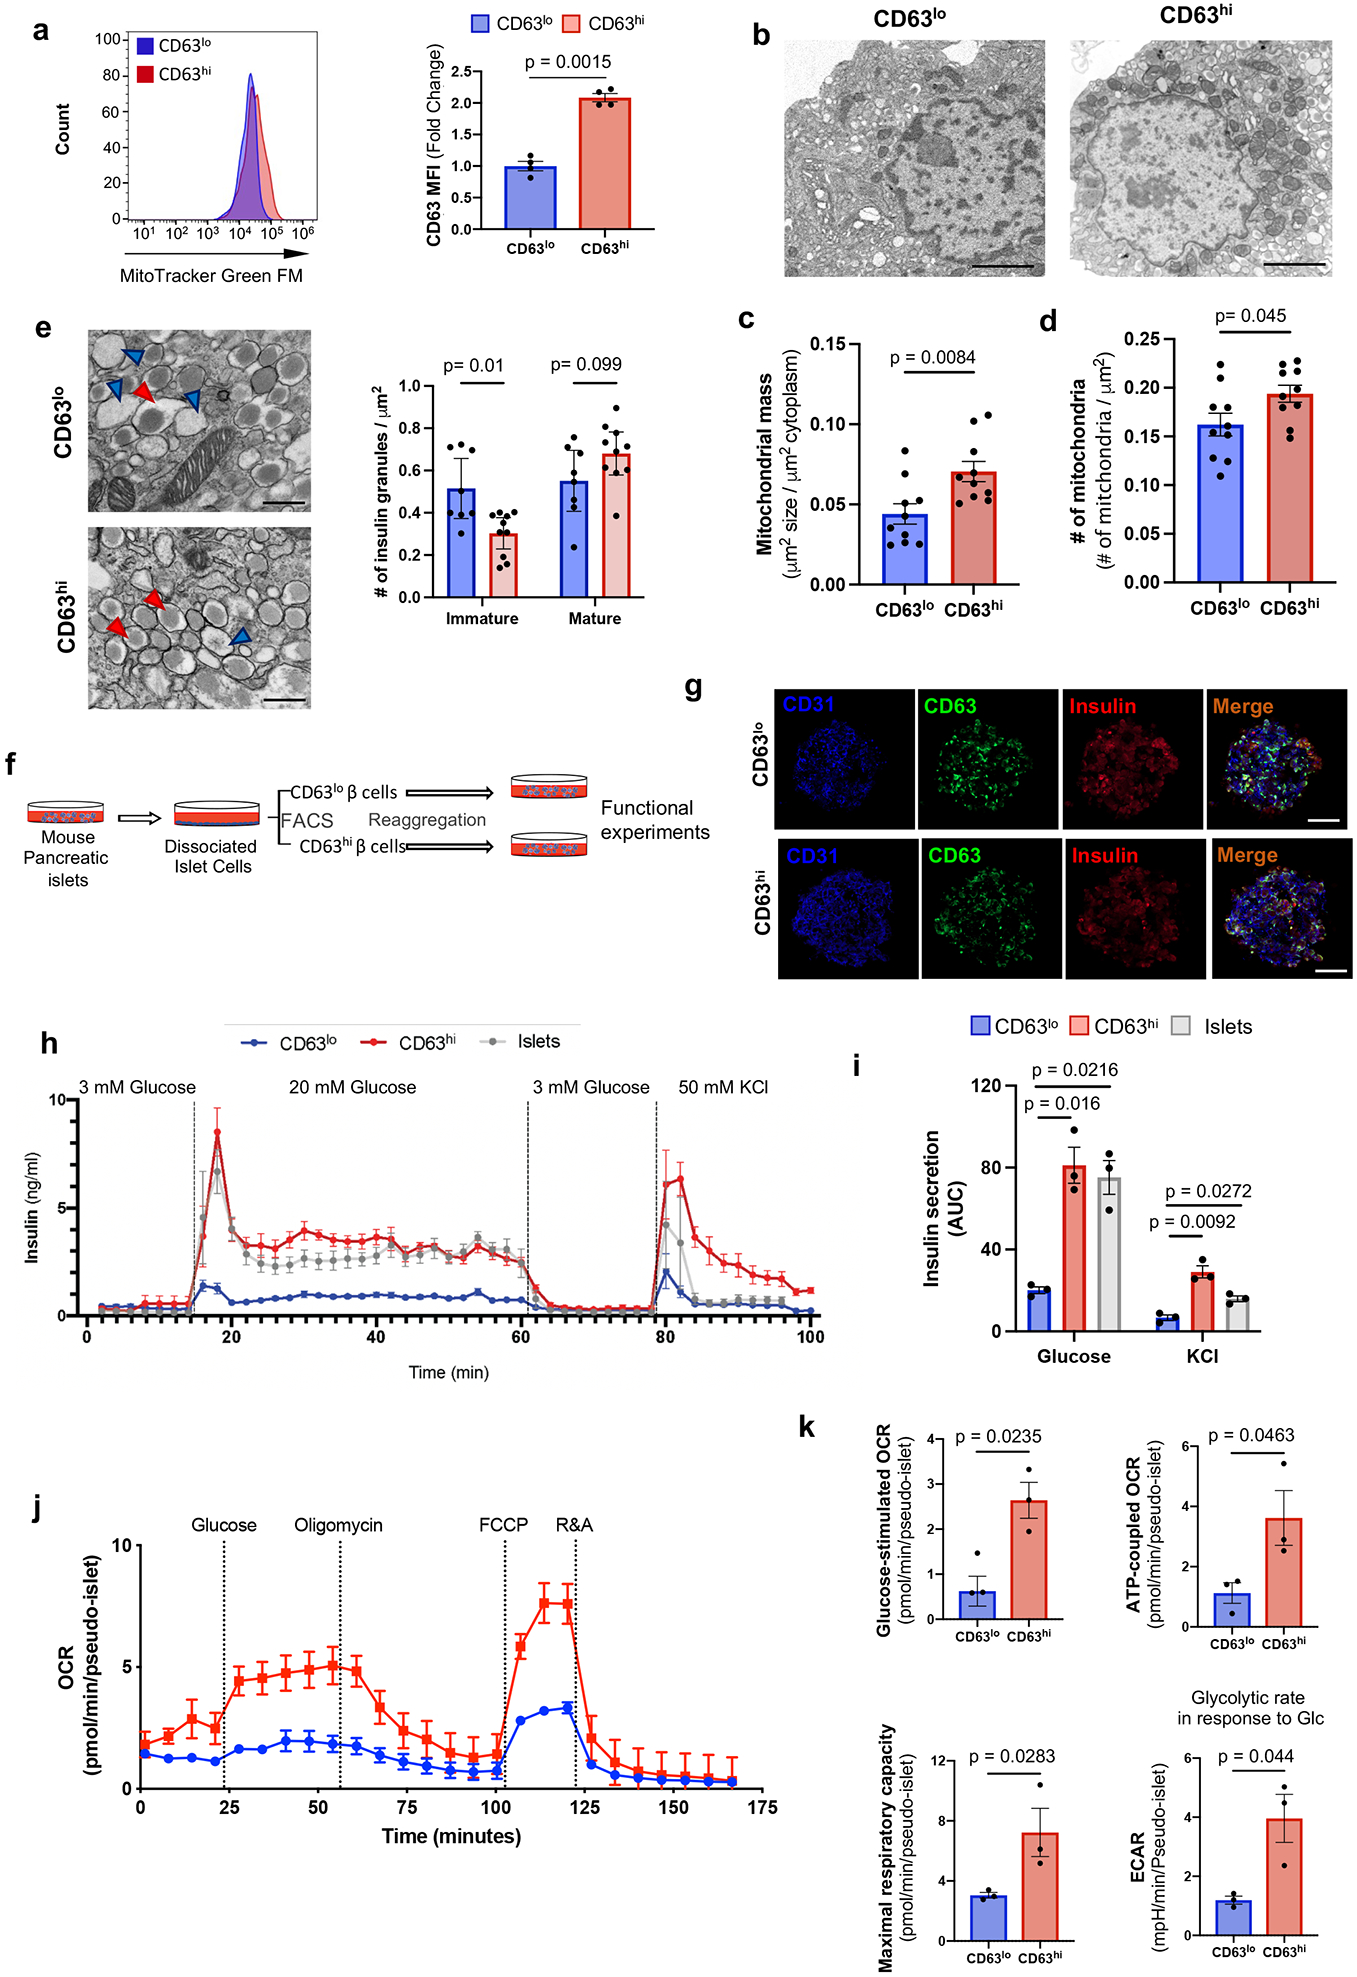
Figure 3. Functional characterization of a metabolically active β cell cluster.

a, Mitochondrial mass in CD63hi and CD63lo β cells assessed by Mitotracker green (MTG). Results are representative of 4 independent experiments. Data are presented as mean±S.E.M. Paired two-tailed t test is used for comparison. b-d, Transmission electron microscopy (TEM) of FAC-sorted CD63hi and CD63lo β cells (Scale bars, 2 μm) (b). Mitochondrial mass (c) and numbers (d) were counted in a blinded manner from 10 fields per group with about 3 cells per field. Welch’s unpaired two-tailed t test is used for comparison. e, Representative TEM images of FAC-sorted CD63hi and CD63lo β cells from mice fed with RD. Blue arrows point to immature secretory granules. Red arrows indicate mature insulin secretory granules. Magnification 30,000x (Scale bars, 500 nm). Quantification of insulin granules normalized by area (right panel). Welch’s unpaired two-tailed t test is used for comparison. Results of granules from CD63lo β cells (8 fields) and CD63hi (10 fields) were pooled from 5mice. f, Schematic illustration of strategy to assemble pseudo-islets from FAC-sorted CD63hi and CD63lo β cells prior to functional assays. g, Representative immunofluorescence images of pseudo-islets showing Insulin (Red), CD63 (Green) and CD31 (Blue) (Scale bars, 50 μm). N=5 pseudo-islets per group. h, Dynamic glucose-stimulated insulin secretion assay of perifused CD63hi and CD63lo pseudo-islets, and whole islets (20 pseudo-islets or whole islets per replicate). Results are representative of 3 independent experiments with 3 replicates. i, Area under the curve (AUC) for insulin secretion in response to glucose and KCl from 3 different perifusion experiments. Data are presented as mean±S.E.M. Paired two-tailed t test is used for comparison. j, Oxygen consumption rates (OCR) of CD63hi and CD63lo pseudo-islets normalized to the number of pseudo-islets per well (20 pseudo-islets). Results are representative of 3 independent experiments. k, Quantification of glucose-stimulated OCR, ATP-coupled OCR, maximal respiratory capacity, and glycolytic rate in response to 20 mM glucose (at least 4 replicates in 3 independent experiments). Data are presented as mean±S.E.M. Unpaired two-tailed t test is used for comparison. Source numerical data are available in source data.
