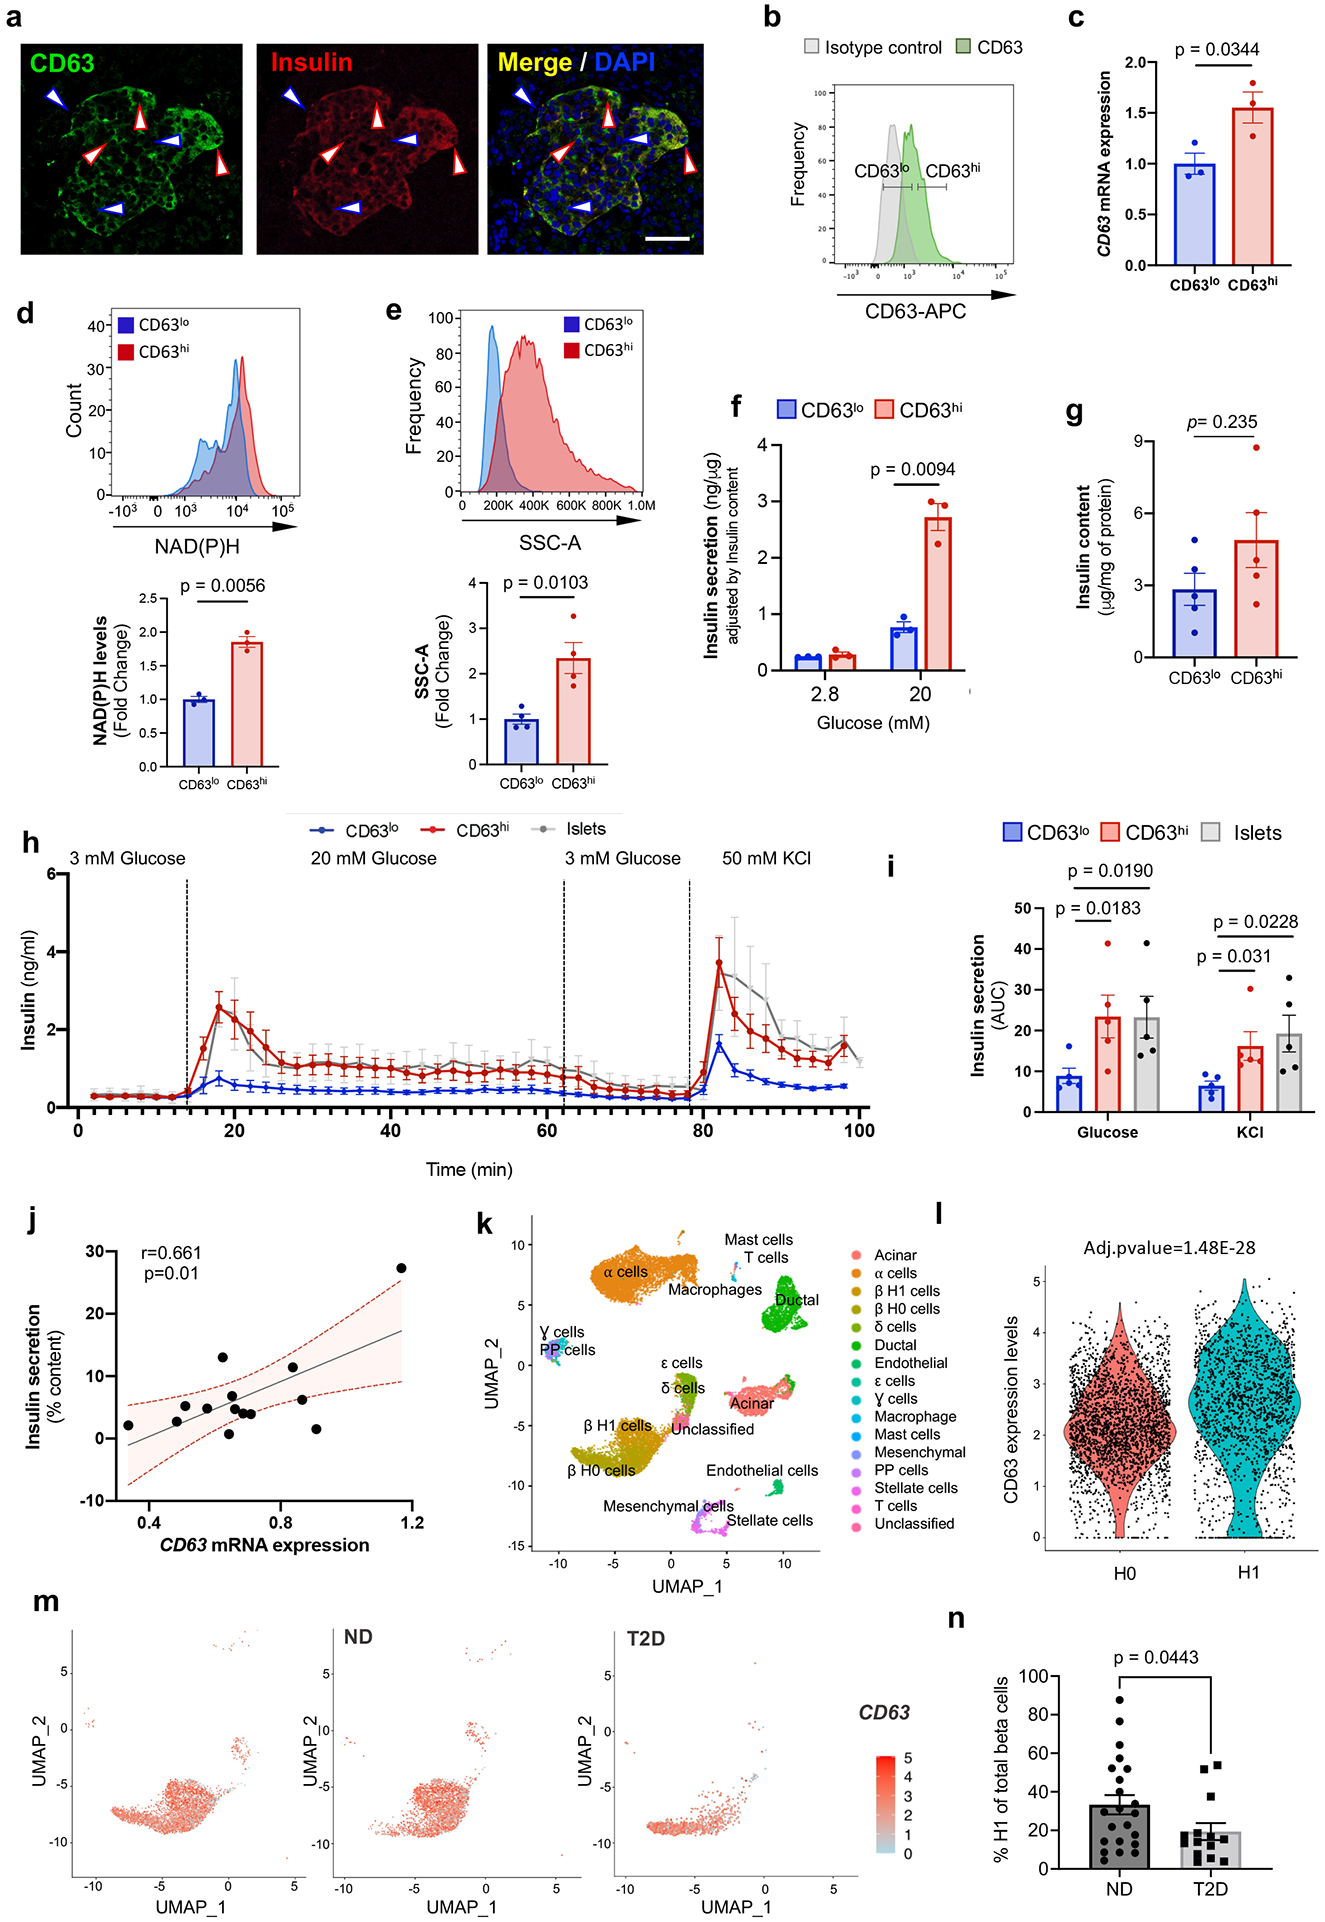
Figure 4. CD63 marks human beta cells with enhanced insulin secretion.

a, Immunofluorescence for CD63 (green), Insulin (red), and DAPI (blue) in human β cells (Scale bar, 50 μm). Blue arrows (CD63lo β cells). Red (CD63hi β cells). Representative of more than 10 fields. b, Flow cytometry analysis of CD63 in human β cells. Representative of 5 independent experiments. c, CD63 expression in sorted human CD63hi and CD63lo β cells determined by RT-qPCR (N=3 independent experiments) d, NAD(P)H levels in human CD63hi and CD63lo β cells. (N=3 independent experiments). e, Analysis of cellular granularity in human CD63hi and CD63lo β cells assessed by side scatter (SSC) (N=4 independent experiments). f, Static glucose-stimulated insulin secretion (GSIS) assay in CD63hi and CD63lo human pseudo-islets at 2.8 or 20 mM glucose (N=3 independent experiments). g, Insulin content of CD63hi and CD63lo human pseudo-islets normalized by intracellular protein (N=5 samples per group). h, Dynamic GSIS in CD63hi and CD63lo human pseudo-islets subjected to indicated concentrations of glucose and KCl (20 pseudo-islets or whole islets per replicate. i, Area under the curve (AUC) for insulin secretion in response to 20mM glucose and 50mM KCl shown in h (N = 5 independent experiments [5 donors]). j, Correlation between human islet CD63 expression and insulin secretion to 16.7mM glucose (N=14 donors). Linear regression with Pearson correlation coefficient analysis (bars indicate the 95% confidence intervals). k, UMAP projection of human pancreatic cells from integrated analysis of five human pancreatic islet scRNA-Seq studies across non-diabetic (ND, N=29) and type 2 diabetes (T2D, N=15) donors. l, Violin plots for CD63 in H0 and H1 β cell subclusters. m, CD63 expression in β cells in ND and T2D donors using UMAP analysis. All β cells on left panel. n, Frequency of Cluster H1 cells in ND (N=22) and T2D (N=14) donors with at least 13 β cells. Data are presented as mean±S.E.M and paired two-tailed t test is used for comparison in c, d, e, f, g, and i. Welch’s unpaired two-tailed t test is used for comparison in m. Source numerical data are available in source data.
