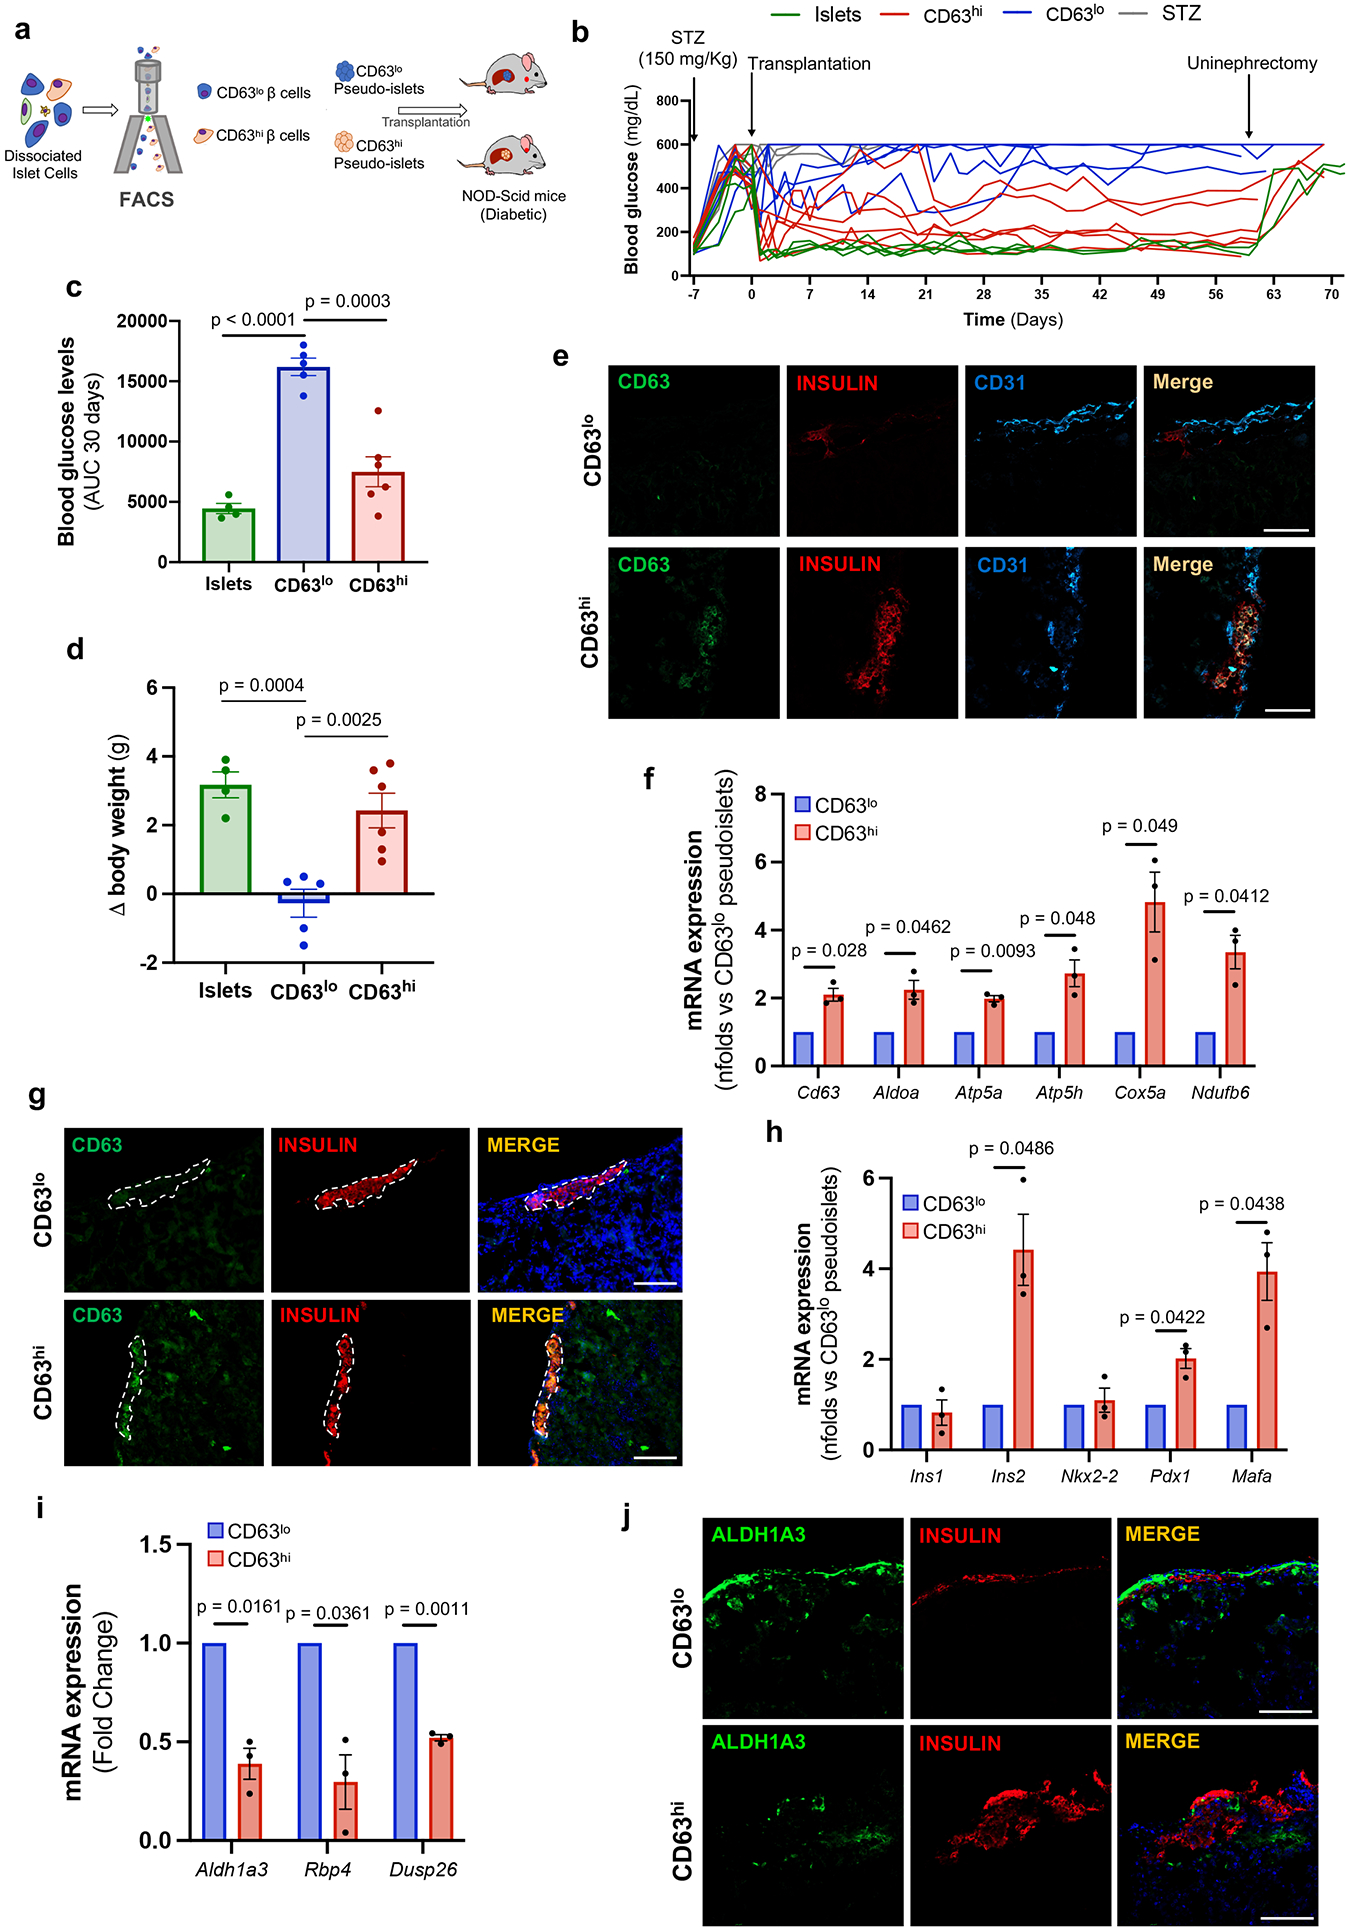
Figure 6. CD63hi beta cells restores euglycemia to diabetic mice.

a, Schematic illustration of CD63hi and CD63lo pseudo-islet transplantation into diabetic NOD-SCID mice previously treated with streptozotocin (STZ). b, Random-fed blood glucose levels in mice transplanted with 150 whole islets (N=4; 2 were followed for 30 days), CD63lo pseudo-islets (N=5), or CD63hi pseudo-islets (N=6). Untransplanted STZ mice remained hyperglycemic (N=3). c, Area under the curve (AUC) of blood glucose levels for 30 days after transplantation until uninephrectomy. Whole islets (N=4), CD63lo pseudo-islets (N=5), or CD63hi pseudo-islets (N=6). Welch’s unpaired two-tailed t test is used for comparison. d, Change in body weight 30 days after transplantation in diabetic NOD-SCID transplanted with 150 whole islets (N=4), CD63lo pseudo-islets (N=5), or CD63hi pseudo-islets (N=6). Data are presented as mean±S.E.M. Welch’s unpaired two-tailed t test is used for comparison. e, Representative immunofluorescence images showing CD63 (green) and insulin (red) and CD31 (blue) in grafted kidney sections from NOD-SCID mice 60 days post-transplantation (N=3 per group) (Scale bars, 100 μm). f, mRNA expression of Cd63 and indicated metabolic genes in CD63hi and CD63lo pseudo-islets 60 days after transplantation determined by RT-qPCR. Paired two-tailed t test is used for comparison (N=3 per group). g, Representative immunofluorescence images of CD63 (green) and insulin (red) in grafted kidney sections 60 days post-transplantation (Scale bars, 100 μm) (N=3 independent experiments). h, mRNA expression ofβ cell signature genes in CD63hi and CD63lo pseudo-islets 60 days after transplantation determined by RT-qPCR. Paired two-tailed t test is used for comparison (N=3 per group). i, mRNA expression of indicated genes in grafted CD63hi and CD63lo pseudo-islets determined by RT-qPCR. Paired two-tailed t test is used for comparison (N=3 per group). j, Representative immunofluorescence images of Aldh1a3 (green) and insulin (red) in grafted kidney sections 60 days post-transplantation (Scale bars, 100 μm). Paired two-tailed t test is used for comparison (N=3 per group). Data are presented as mean±S.E.M. Source numerical data are available in source data.
