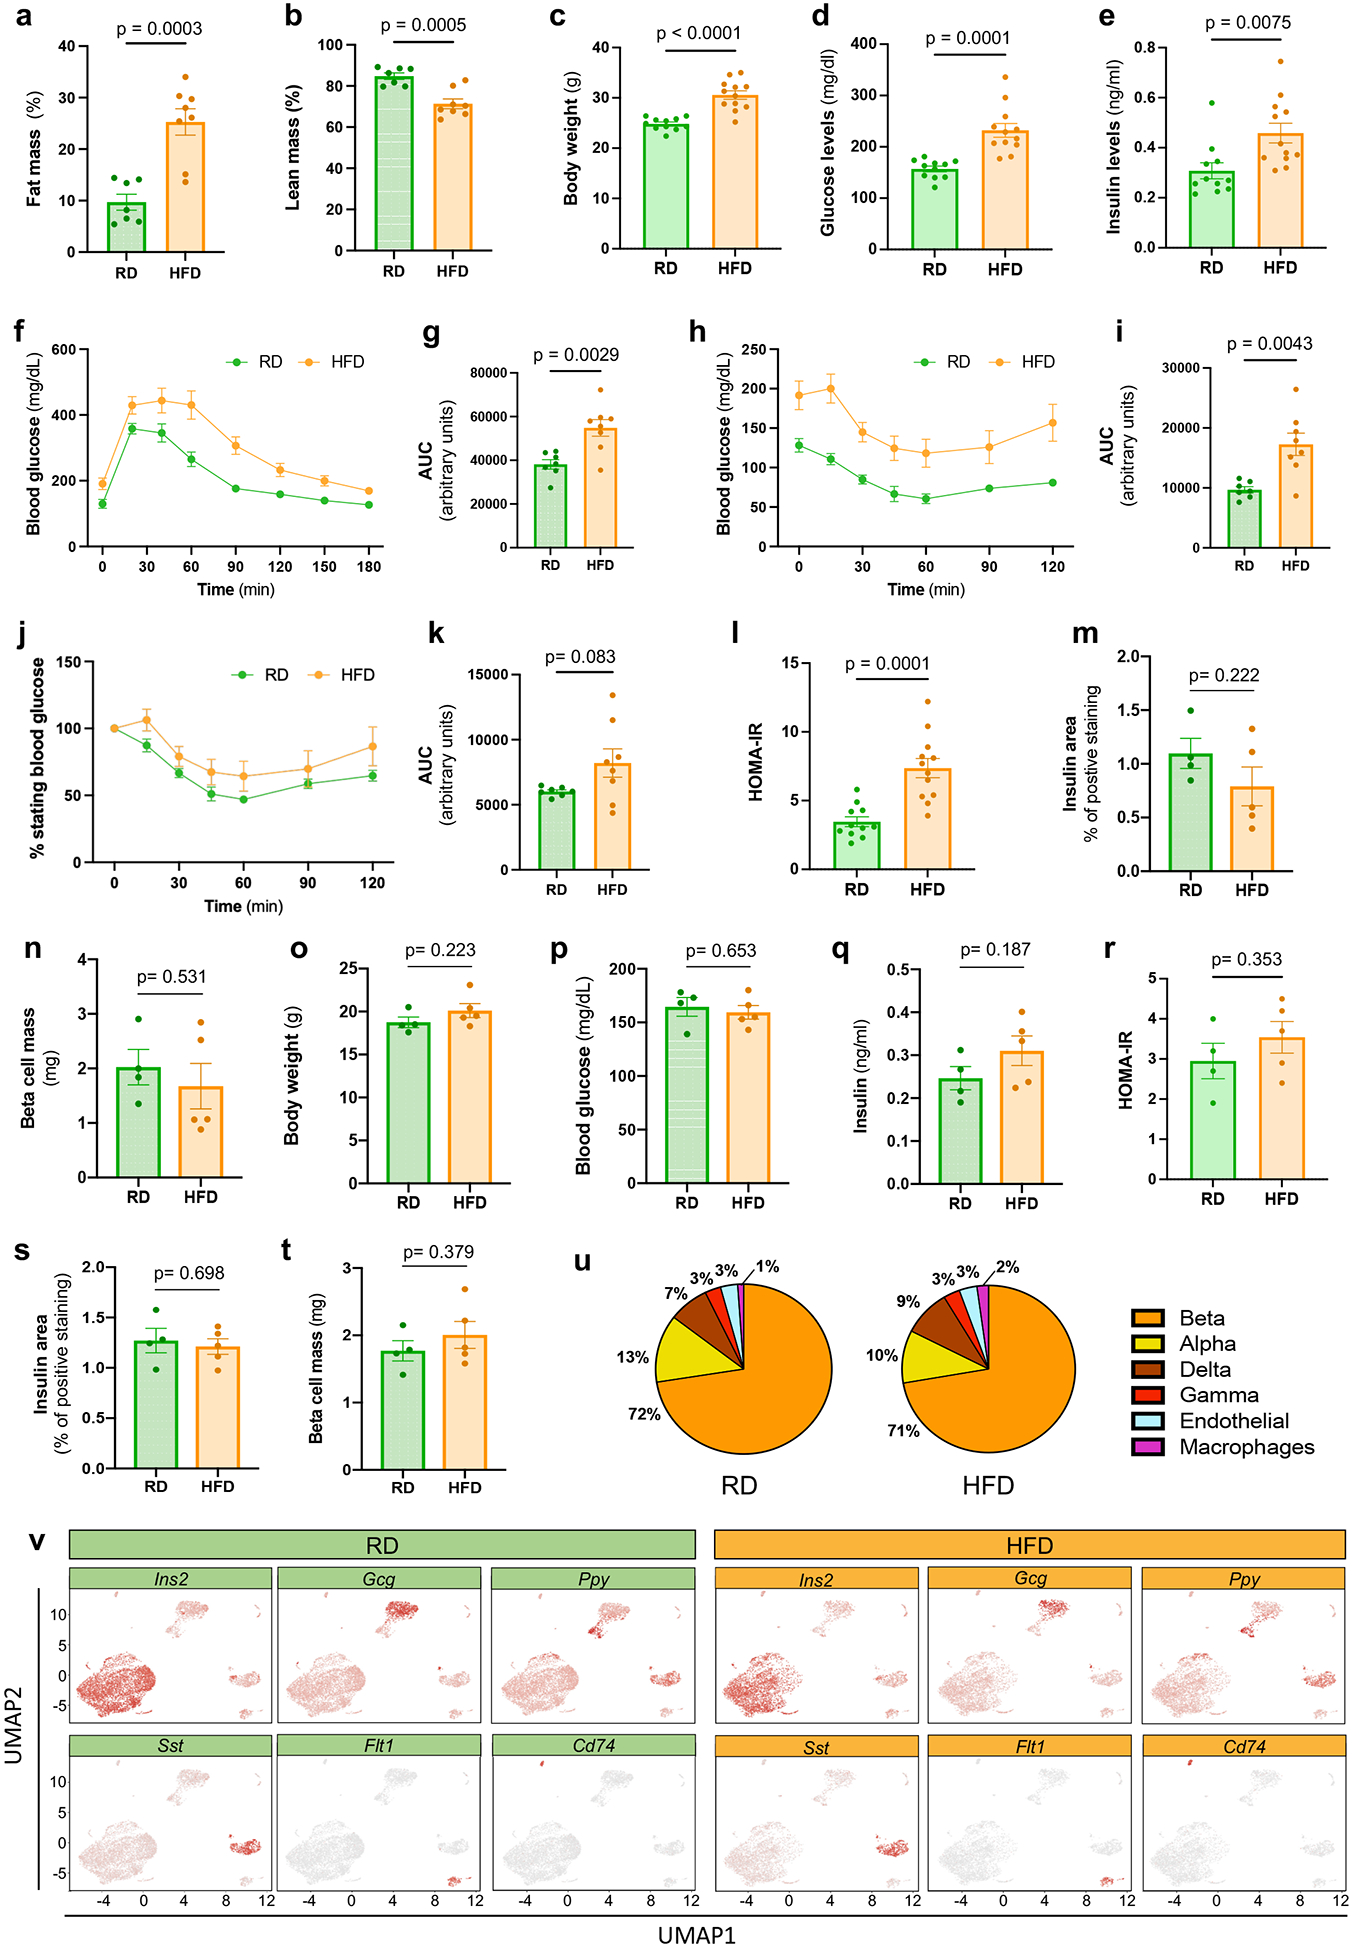
Extended Data Figure 1. Characteristics of diet-induced obesity model used for scRNA-Seq.

a-b, Percentages of fat mass (a), lean mass (b) in male mice fed with regular diet (RD, N=7) or high fat diet (HFD, N=8) for 6 weeks after weaning. c-e, Body weights (c), 6 hours fasting blood glucose (d), 6 hours fasting insulin (e) levels in male mice fed with RD (N=11) or HFD (N=12) for 6 weeks after weaning. f-g, Glucose tolerance test (GTT) was performed on RD (N=7) and HFD (N=8) fed male mice for 6 weeks with measurement of blood glucose concentrations (f). Area under the curve (AUC) of blood glucose levels (g). h-k, Insulin tolerance test (ITT) was performed on RD (N=7) and HFD (N=8) fed male mice for 7 weeks (h). AUC of blood glucose levels in h (i). ITT plotted as a % of starting glucose value (j). AUC of values plotted in j after t0 (k). l, Homeostasis model assessment for insulin resistance (HOMA-IR) index of male mice fed with RD (N=11) or HFD (N=12) for 6 weeks after weaning (insulin [mU/L]* glucose [mg/dL] )/405. m-n, Quantification of β cell area (m) and mass (n) in RD (n=4) and HFD (n=5) fed male mice. o-r, Body weights (o), 6 hours fasting blood glucose (p), 6 hours fasting insulin levels (q), HOMA-IR (r) of female mice fed with regular diet (RD, N=4) or high fat diet (HFD, N=5) for 6 weeks after weaning. s-t, Quantification of β cell area (s) and mass (t) in RD (n=4) and HFD (n=5) fed female mice. u, Distribution of pancreatic islet cell clusters from RD (left chart) and HFD (right chart) fed male mice. v, UMAPs representing expression of known marker genes across the cell clusters Ins1 (beta cells), Gcg (alpha cells), Sst (delta cells), Ftl1 (endothelial cells), Ppt (gamma cells), and Cd74 (immune cells) in male mice fed with RD (left panel) and HFD (right panel). All data are presented as mean ± S.E.M. and Welch’s unpaired two-tailed t test is used for comparison. Source numerical data are available in source data.
