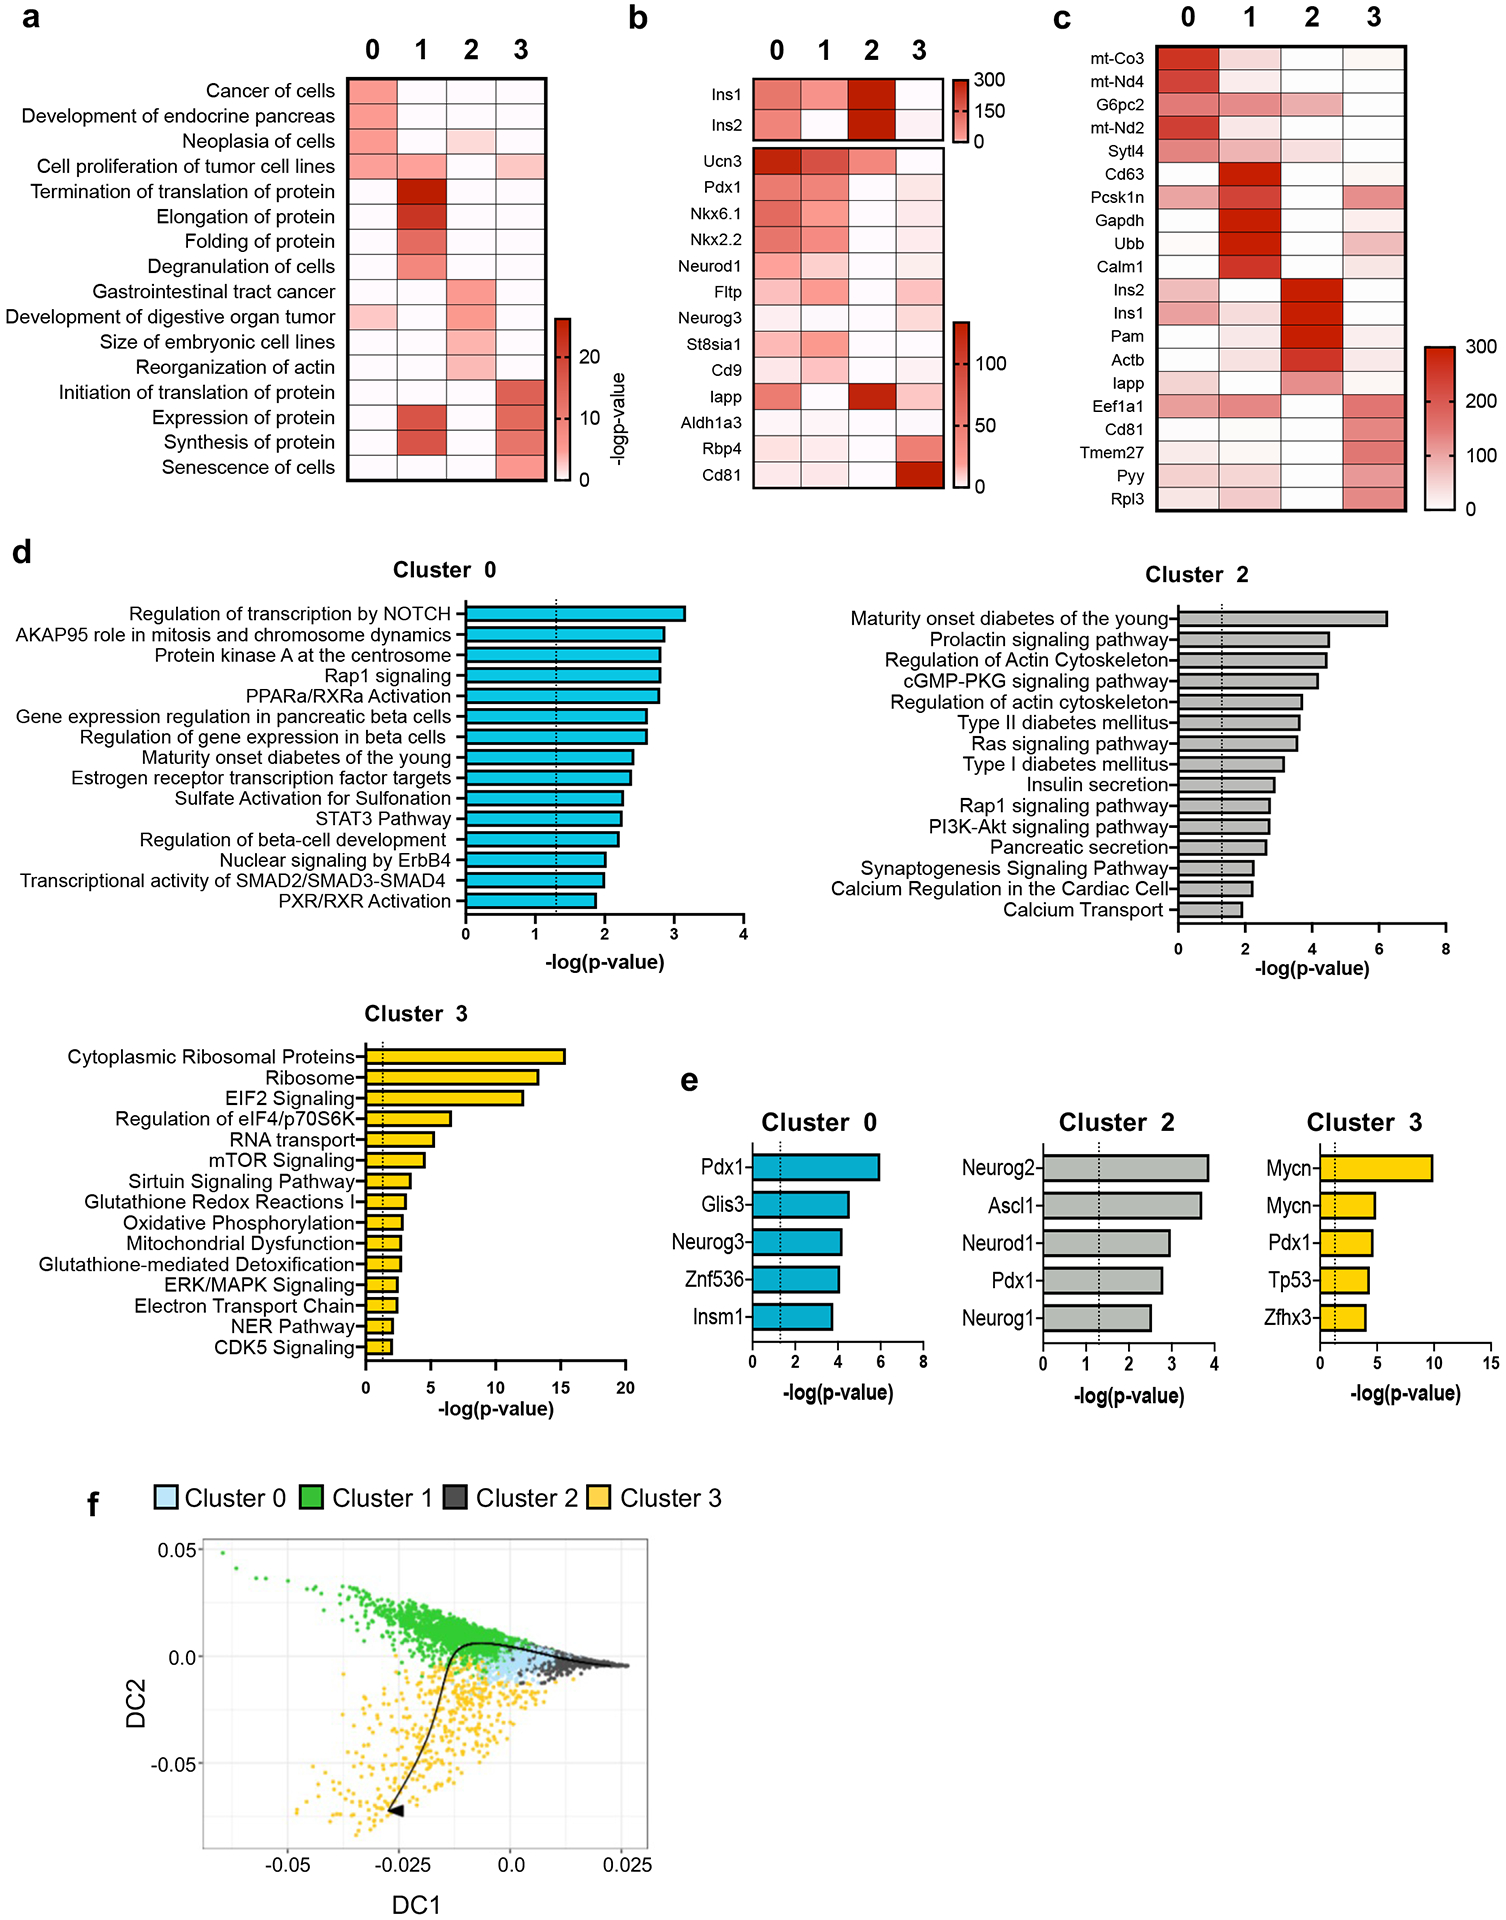
Extended Data Figure 2. Molecular analysis of β cell clusters.

a, Top 4 enriched biological processes for the indicated β cell clusters (p-value was calculated using two-tailed Benjamini-Hochberg). b, Heatmap showing select genes previously identified to be heterogeneously expressed in β cells in each of the indicated β cell clusters. c, Top 5 differentially expressed genes (DEGs) for the indicated β cell clusters. d, Pathway enrichment analysis of DEGs in Cluster 0, Cluster 2, and Cluster 3 β cells ordered by statistical significance (p-value was calculated using two-tailed Benjamini-Hochberg). e, Top 5 transcription factors predicted in Cluster 0, Cluster 2, and Cluster 3 β cells ordered by statistical significance (p-value was calculated using two-tailed Benjamini-Hochberg). f, Trajectory of the different β cell clusters predicted by Slingshot analysis. Source numerical data are available in source data.
