
Figure 5.
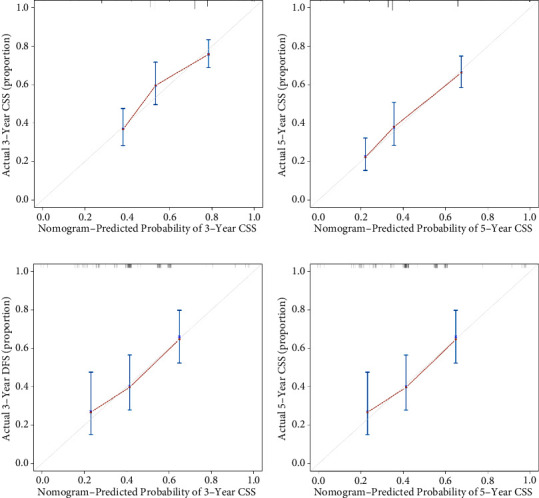
Calibration plot of constructed nomogram for the prediction of 3-year and 5-year CSS. The bootstrapped calibration plot compared predicted probability (X-axis) and observed risk (Y-axis) at different levels in different groups (3 groups, B = 1000) for the prediction of CSS in training cohort (a, b) and validation cohort (c, d). Grey line is the predictional line of an ideal calibration model which is along the 45° diagonal line.