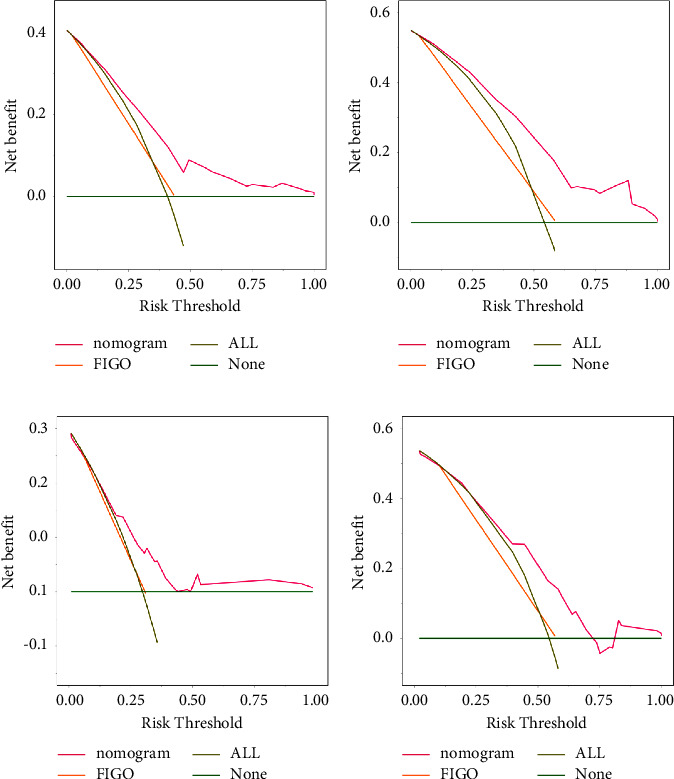
Figure 6.

DCA curves of constructed nomogram for the prediction of 3-year and 5-year CSS. The pink line and orange line in DCA curves show the clinical benefit when the clinical strategy was decided by the prediction of the constructed nomogram or FIGO stage in 3-year and 5-year CSS of training cohort (a, b) and validation cohort (c, d), respectively. X-axis is threshold probability and Y-axis shows the clinical decision net benefits after the benefits minus the disadvantages. “All” indicates the benefit when all patients are treated with clinical interference and “None” indicates the benefit when no patients are treated with clinical interference.
