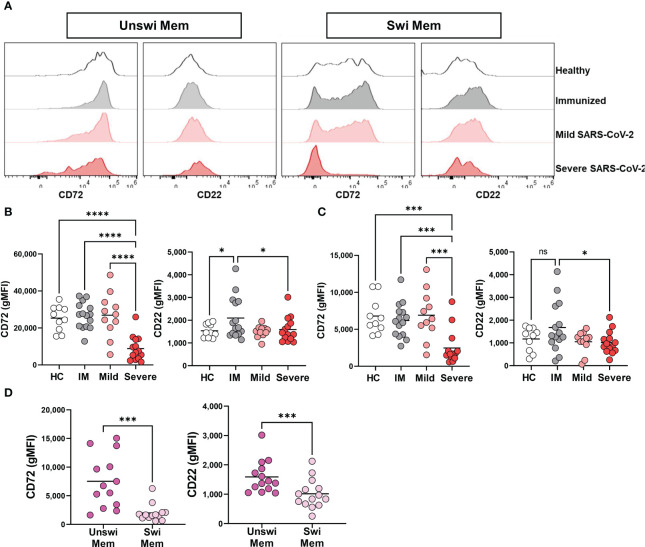
Figure 4.
Loss of inhibition on Unswitched and Switched Memory B cells with Severe SARS-CoV-2 infection. (A) Representative histograms displaying expression of CD72 and CD22 on unswitched or switched memory B cells from a healthy control (HC), immunized control (IM), mild or severe SARS-CoV-2 infected subject. (B) Quantification of expression level (geometric MFI) of CD72 and CD22 on unswitched or (C) switched memory B cells from each cohort. Sample size: Healthy controls (HC; N=10), Immunized controls (IM; N=15), subjects with Mild (N=11) or Severe SARS-CoV-2 infection (N=14). (D) Comparison of unswitched to switched memory B cells from severely infected SARS-CoV-2 individuals. Statistics: One-way ANOVA or paired t test, ns, not significant *p<0.05, ***p<0.01, ****p<0.0001.

