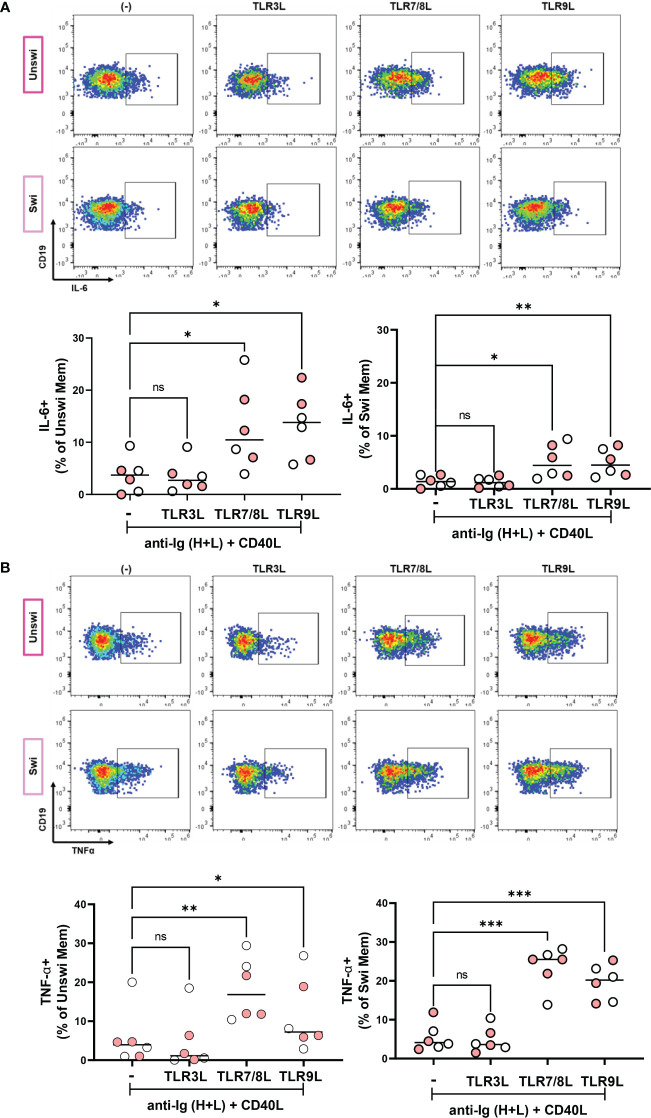
Figure 8.
IL-6 and TNFα production by Unswitched and Switched Memory B cells in response to viral TLR ligand stimulation. (A) Representative flow plots from a mild SARS-CoV-2 subject and quantification of IL-6+ or (B) TNFα+ unswitched or switched memory B cells from healthy controls (white, N=3) or subjects with mild SARS-CoV-2 infection (red, N=3) upon PBMC 4 hour in vitro stimulation with 10ug/mL anti-Ig (H+L) F(ab)’2 + 100ng/mL CD40L and with either 1ug/mL TL3RL (Poly I:C), 1ug/mL TLR7/8L (R848), or 2.5ug/mL TLR9L (CpG). Statistics: one way ANOVA, ns not significant, *p<0.05, **p<0.01, ***p<0.001.

