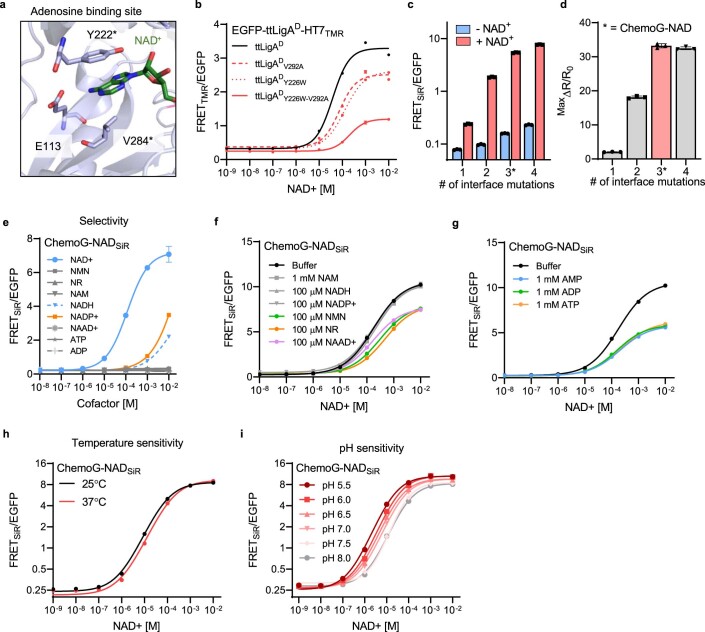
Extended Data Fig. 6. Engineering and characterization of ChemoX-NAD sensors.
a. Zoom-in on the NAD+ binding site of the X-ray structure of LigA from Enterococcus faecalis (efLigA) bound to NAD+ (PDB ID: 1TAE). The structure is represented as cartoon (light blue) and NAD+ (green) and residues involved in the binding of NAD+ (Y222 and V284, light blue) are represented as sticks. *Y222 and V284 of efLigA correspond to Y226 and V292 of LigA from Thermus thermophilus (ttLigA). b. NAD+ titrations of sensor variants labeled with TMR. ttLigAD carries the extra mutations K117L and D289N rendering it catalytically inactive. Mutations Y226W and Y292A shift the sensor response towards the range of free intracellular NAD+. c. FRET ratios of NAD+ sensors differing in the number of interface mutations (Supplementary Table S5) in presence (+NAD+) or absence (-NAD+) of 1 mM NAD+. d. Maximal FRET/eGFP ratio change (MaxΔR/R0) of NAD+ sensors differing in the number of interface mutations. Asterisk indicates construct corresponding to the final sensor ChemoG-NAD. e. Titration of ChemoG-NAD with NAD+ or structurally related molecules. f. Titration of ChemoG-NADSiR with NAD+ in presence of different structurally related molecules. g. Titration of ChemoG-NADSiR with NAD+ in presence of 1 mM AMP, ADP or ATP. h, i. NAD+ titrations of ChemoG-NADSiR at different temperatures (h) or at different pH (i). For all graphs, the means of 3 technical replicates ±s.d. are shown.

