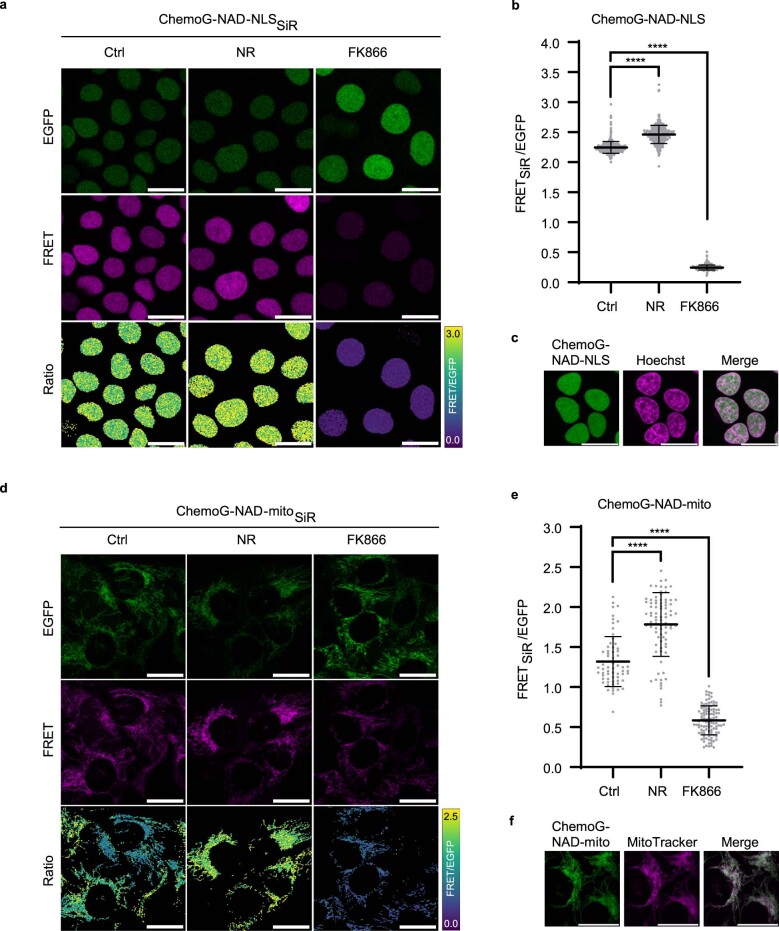
Extended Data Fig. 7. Performance of ChemoG-NAD in different subcellular compartments.
a, d. Confocal images of U-2 OS cells expressing ChemoG-NAD in the nucleus (ChemoG-NAD-NLS, a) or mitochondria (ChemoG-NAD-mito, d) labeled with SiR. Shown are the eGFP channel, FRET channel and ratio image (FRET/eGFP) in pseudocolor (LUT = mpl-viridis). Cells were treated for 24 h either with DMSO (Ctrl), 100 nM FK866 or 1 mM NR. All scale bars = 25 μm. b, e. FRET/eGFP ratios of U-2 OS cells corresponding to panels a and d, respectively. Shown are the FRET/eGFP ratios of single cells (circles) and the mean ±s.d. (black line) (nucleus: n = 353 (ctrl), 311 (NR), 300 (FK866) cells; mitochondria: n = 63 (ctrl), 85 (NR), 109 (FK866) cells; from 3 independent experiments). p-values are given based on unpaired two-tailed t-test with Welch’s correction (**** p < 0.0001). c. Confocal images of U-2 OS cells expressing ChemoG-NAD in the nucleus (ChemoG-NAD-NLS) and stained with Hoechst. f. Confocal images of U-2 OS cells expressing ChemoG-NAD in the mitochondria (ChemoG-NAD-mito) and stained with MitoTracker RedFM. All scale bars = 25 μm.

