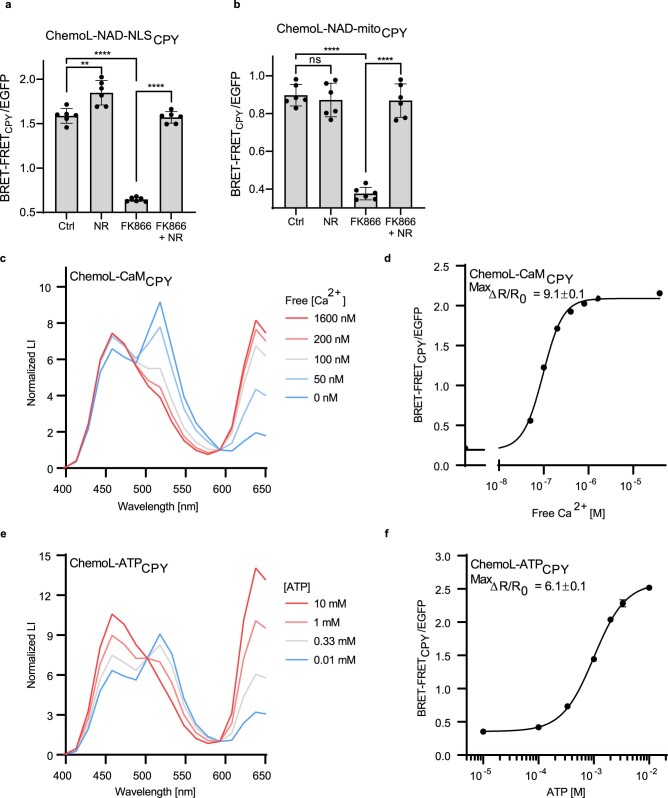
Extended Data Fig. 10. Engineering and characterization of ChemoL sensors.
a, b. BRET-FRET/eGFP ratios of ChemoL-NADCPY expressed in the nucleus (a) or the mitochondria (b) of U-2 OS cells upon treatment for 24 h with DMSO (Ctrl), 1 mM NR, 100 nM FK866 or 100 nM FK866 plus 1 mM NR. Represented are the BRET-FRET/eGFP ratios of single wells (circle) and means ±s.d. (black line) (n = 6 wells from a single experiment). p-values are given based on unpaired two-tailed t-test with Welch’s correction (**** p < 0.0001, ** p = 0.0041, ns p = 0.5718). c, e. Luminescent intensity (LI) spectra of ChemoL-CaM (c) or ChemoL-ATP (e) at different concentrations of calcium and ATP, respectively. The spectra were normalized to the isosbestic point at 593 nm. Constructs were labeled with CPY. Shown are the means of 3 technical replicates. d, f. Analyte titrations of ChemoL-CaM (d) and ChemoL-ATP (f) labelled with CPY. Shown are the mean ±s.d. of BRET-FRET/eGFP ratios (n = 3 technical replicates). Indicated are also the maximum BRET-FRET/eGFP ratio changes (MaxΔR/R0).

