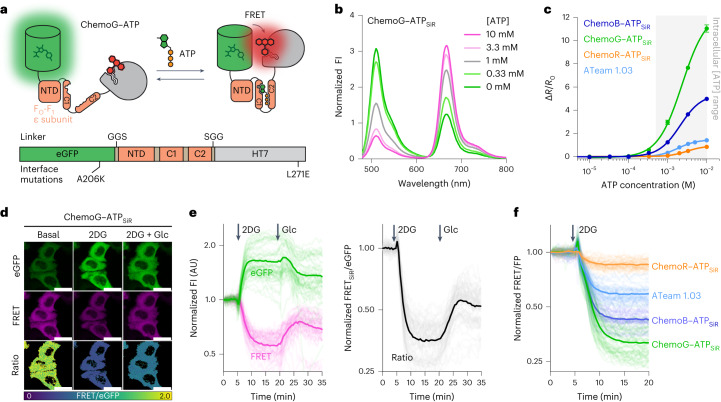
Fig. 3. Development of ratiometric ATP sensors based on ChemoX.
a, Schematic representation of ChemoG–ATP; NTD, N-terminal domain. b, Fluorescence intensity emission spectra of SiR-labeled ChemoG–ATP at different ATP concentrations. Means of three technical replicates are shown; [ATP], ATP concentration. c, ATP titration curves of ChemoX–ATPSiR sensors. Data are shown as the means ± s.d. of the FRET/eGFP ratio changes (ΔR/R0; n = 3 technical replicates). The intracellular ATP concentration range is indicated with a gray box. ΔR/R0 and C50 values are summarized in Supplementary Table 7. d, Confocal images of HeLa Kyoto cells expressing ChemoG–ATP labeled with SiR. Shown are the eGFP channel, the FRET channel and the ratio image of both channels (FRET/eGFP) in pseudocolor (LUT = mpl-viridis). Cells were treated at t = 5 min with 10 mM 2DG. At t = 20 min, 20 mM glucose (Glc) was added to the cells until the end of the experiment (t = 35 min, 2DG + Glc); scale bars, 25 µm. e, Time course measurement of ChemoG–ATPSiR fluorescence intensity in HeLa Kyoto cells. Shown are the eGFP and FRET channels (left) and FRET/eGFP ratio (right) normalized to 1 at t = 0 min. Cells were treated with 10 mM 2DG and subsequently with 20 mM glucose at time points indicated with arrows. Experiments are as explained in d; n = 59 cells from three biological replicates. Represented are the means (solid lines) and traces of the individual cells (dim lines). f, Time course measurement of ChemoB–ATPSiR (n = 58 cells), ChemoG–ATPSiR (n = 63 cells), ChemoR–ATPSiR (n = 52 cells) and ATeam 1.03 (n = 59 cells) fluorescence intensity in HeLa Kyoto cells. The FRET/FP ratio after treatment with 10 mM 2DG is shown. Ratios are normalized to 1 at t = 0 min. Addition of 2DG is indicated with an arrow. Represented are the means (line) and single-cell traces (dim lines) from three biological replicates.

