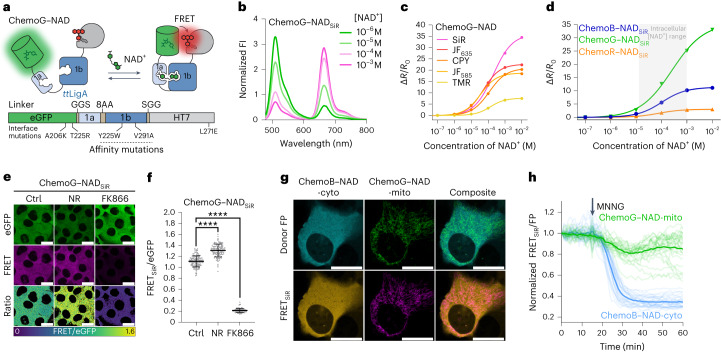
Fig. 4. Multiplexing subcellular NAD+ pools using ChemoX–NAD biosensors.
a, Schematic representation of ChemoG–NAD. b, Normalized fluorescence intensity emission spectra of SiR-labeled ChemoG–NAD at different NAD+ concentrations. Means of three technical replicates are shown; [NAD+], NAD+ concentration. c, NAD+ titration curves of ChemoG–NAD labeled with different fluorophores. Data are shown as the means ± s.d. of the FRET/eGFP ratio changes (ΔR/R0; n = 3 technical replicates). ΔR/R0 and C50 values are summarized in Supplementary Table 8. d, NAD+ titration curves of ChemoX–NADSiR biosensors. Data are shown as the means ± s.d. of the FRET/eGFP ratio changes (ΔR/R0; n = 3 technical replicates). The intracellular free NAD+ concentration range is indicated with a gray box. ΔR/R0 and C50 values are summarized in Supplementary Table 8. e, Confocal images of U-2 OS cells expressing ChemoG–NAD labeled with SiR. Shown are the eGFP channel, the FRET channel and the ratio image of both channels (FRET/eGFP) in pseudocolor (LUT = mpl-viridis). Cells were treated for 24 h with DMSO (Ctrl), 100 nM FK866 or 1 mM NR; scale bars, 25 µm. f, Dot plots representing the FRET/eGFP ratios of ChemoG–NADSiR expressed in U-2 OS cells treated as described in d; n = 133 (Ctrl), 117 (NR) and 132 (FK866) cells from three independent experiments. P values are given based on unpaired two-tailed t-test with Welch’s correction; ****P < 0.0001. Data are shown as the means ± s.d. g, Confocal image of U-2 OS cell coexpressing ChemoB–NAD-cyto and ChemoG–NAD-mito labeled with SiR. Shown are the FRET donor FP channels, the FRET channels and the composites of the FP or FRET channel of both sensors pseudocolored (eBFP2 (cyan), eGFP (green), eBFP2-FRET (orange) and eGFP-FRET (magenta)). The brightness of the donor and FRET channels was adjusted to show potential cross-talk between the channels; scale bars, 25 µm. h, Time course measurement of ChemoB–NAD-cyto (cytosol) and ChemoG–NAD-mito (mitochondria) fluorescence intensity coexpressed in U-2 OS cells and labeled with SiR. Represented are the means of the FRET/FP ratios (line) and single-cell traces (dim lines) normalized to 1 at t = 0 min. The addition of MNNG is indicated with an arrow (n = 28 cells from four biological replicates).

