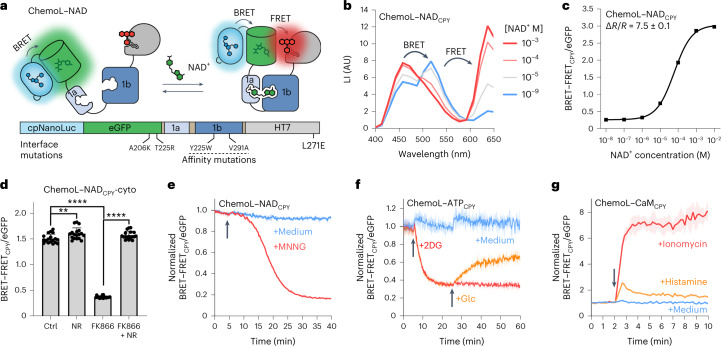
Fig. 6. Conversion of ChemoG-based biosensors into luminescent ChemoL biosensors.
a, Schematic representation of ChemoL–NAD. b, Luminescent intensity (LI) emission spectra of CPY-labeled ChemoL–NAD at different NAD+ concentrations. Means of three technical replicates are shown. c, NAD+ titration curve of ChemoL–NADCPY. Shown are the mean BRET–FRETCPY/eGFP luminescence ratios ± s.d of three technical replicates. d, ChemoL–NADCPY BRET–FRET/eGFP ratios in U-2 OS cells after treatment for 24 h with DMSO (Ctrl), 1 mM NR, 100 nM FK866 or 100 nM FK866 and 1 mM NR. Represented are the means ± s.d. and single-well ratios (circles; n = 18 wells per condition from three biological replicates). P values are given based on unpaired two-tailed t-tests with Welch’s correction; **P = 0.006; ****P < 0.0001. e, Time course measurement of ChemoL–NADCPY expressed in U-2 OS cells. Represented are the means of the BRET–FRET/eGFP ratios (line) ± s.d. (shaded areas) normalized to 1 at t = 0 min. Cells were untreated (+medium) or treated (+MNNG) with MNNG at t = 5 min indicated with an arrow (n = 3 wells from one representative biological replicate; two additional biological replicates can be found in Supplementary Fig. 10). f, Time course measurement of ChemoL–ATPCPY expressed in HeLa Kyoto cells. Represented are the mean BRET–FRET/eGFP ratios (line) ± s.d. (shaded areas) normalized to 1 at t = 0 min. Cells were untreated (medium), treated with 2DG at t = 5 min (red and orange) and additionally treated with glucose at t = 25 min (orange). Addition of medium, 2DG and glucose is indicated with an arrow (n = 3 wells from one representative biological replicate; two additional biological replicates can be found in Supplementary Fig. 10). g, Time course measurement of ChemoL–CaMCPY expressed in HeLa Kyoto cells. Shown are the mean BRET–FRET/eGFP ratios (line) ± s.d. (shaded areas) normalized to 1 at t = 0 min. Cells were untreated or treated with histamine or ionomycin at t = 2 min (n = 3 wells from one representative biological replicate; two additional biological replicates can be found in Supplementary Fig. 10). Addition of drugs is indicated with an arrow.

