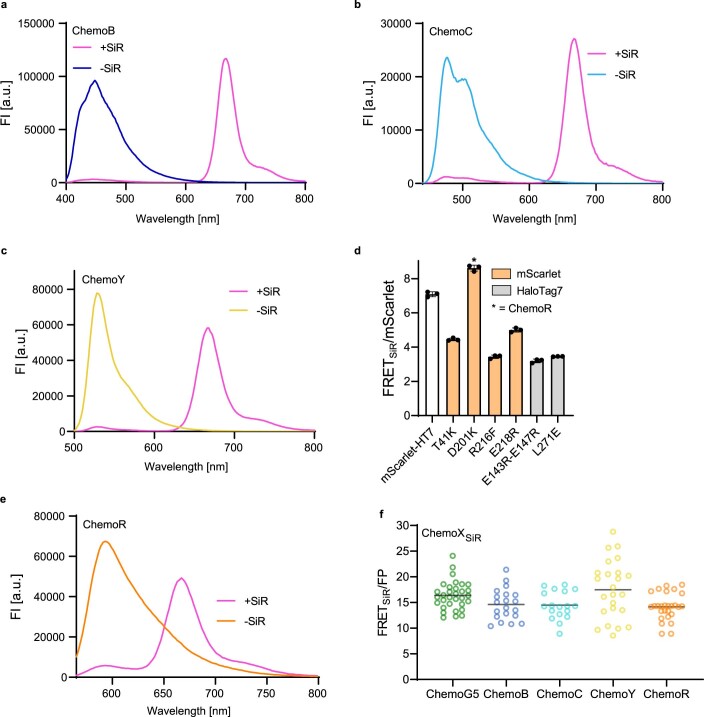
Extended Data Fig. 2. Expansion of ChemoG to other donor FPs.
a-c, e. Fluorescence intensity (FI) emission spectra of optimized ChemoB (a), ChemoC (b), ChemoY (c) or ChemoR (e) labeled with SiR (+SiR) or unlabeled (-SiR). Interface mutations, FRET ratios and FRET efficiencies are listed in Supplementary Table S4. Shown are the means of 3 technical replicates. d. FRET/mScarlet ratios of SiR-labeled mScarlet-HT7 and mScarlet-HT7 variants with different mutations on mScarlet (orange) or HT7 (grey). The mutation D201K used in the optimized ChemoR construct is marked with an asterisk. Shown are the means ±s.d. (n = 3 technical replicates) f. FRET ratios of ChemoX constructs expressed in U-2 OS cells and labeled with SiR (n > 17 cells). Plotted for each construct are the FRET/FP ratios of individual cells (circles) and the mean (black line). The values are derived from 2 independent experiments.

