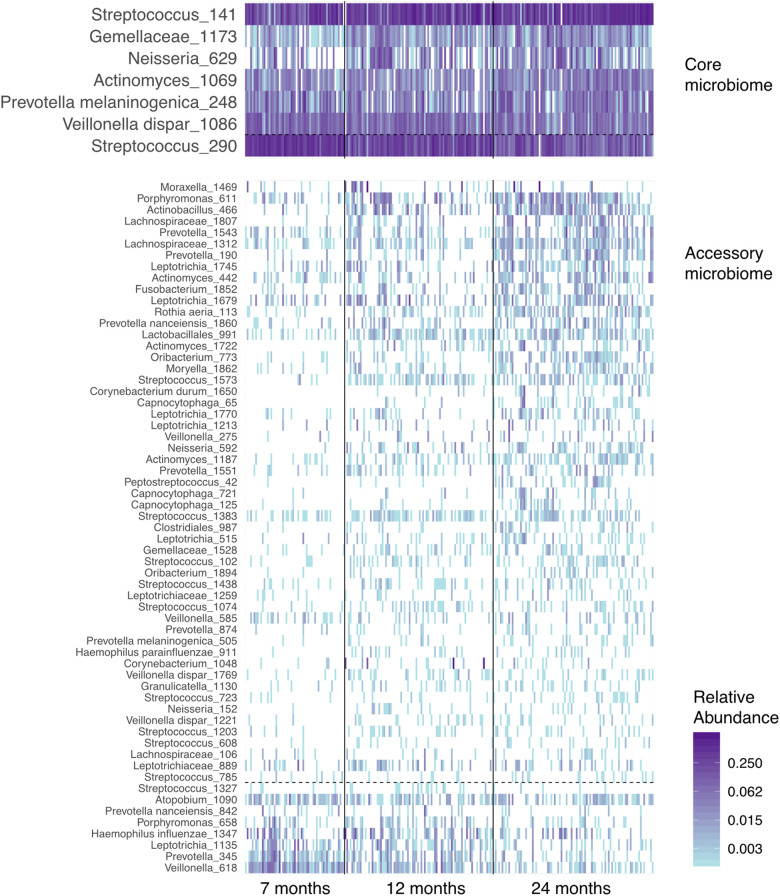
Figure 4.
A heatmap of the abundance of the “core” and “accessory” microbiota in airway samples from the ECUAVIDA cohort. Vertical lines divide the age classes of children. Horizontal dashed lines separate OTUs, which increase between 7 and 24 months of age (above the line), and those that decrease (below the line). OTUs in fewer than 10% of samples are not shown, and the “core microbiome” is defined as those in over two-thirds of samples.

