Fig. 4.

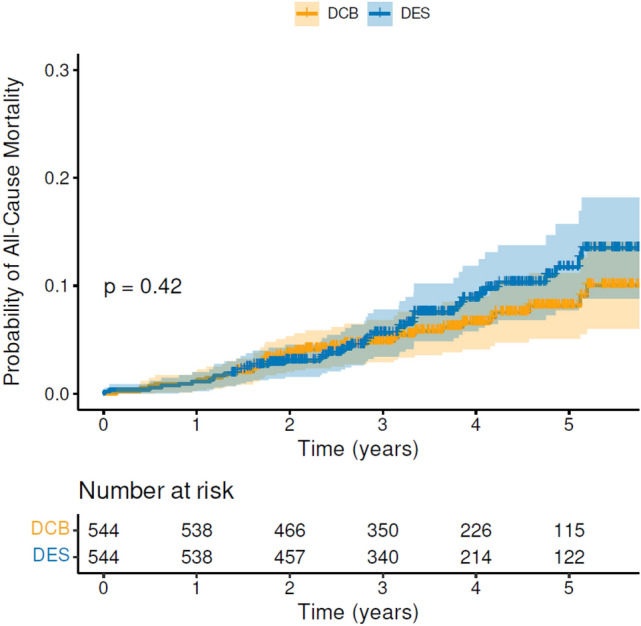
Cumulative hazard plot of all-cause mortality in propensity score-matched cohort, for DCB vs 2nd-generation DES with numbers at risk shown at the bottom of the graph. DCB drug-coated balloon, DES drug-eluting stent

Cumulative hazard plot of all-cause mortality in propensity score-matched cohort, for DCB vs 2nd-generation DES with numbers at risk shown at the bottom of the graph. DCB drug-coated balloon, DES drug-eluting stent