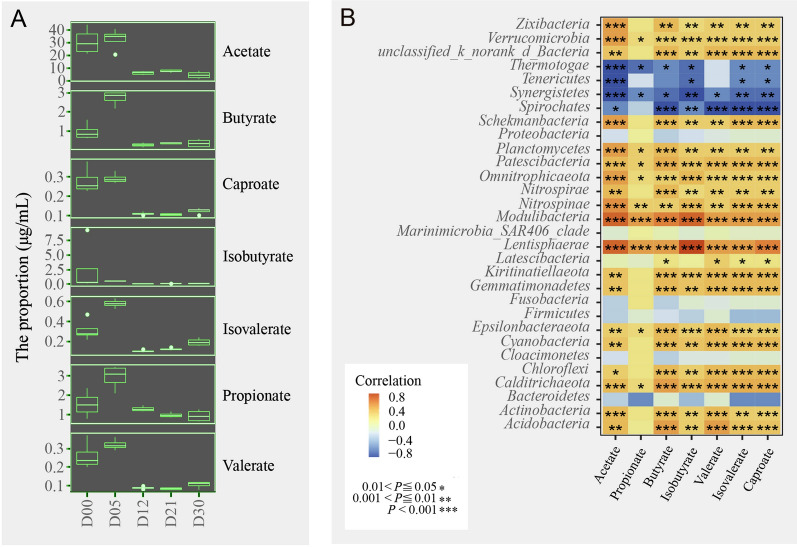
Fig. 4.
Correlations amongst community compositions and SCFAs. A Ranges of SCFA concentrations in different incubation stages. B Pearson correlations amongst different phyla in all incubation stages and SCFAs. The gradient colours represent the different correlations. The black points are within the abundant taxa community, and the red points are within the rare taxa community in all incubation stages. *0.01 < P ≤ 0.05, **0.001 < P ≤ 0.01, ***P ≤ 0.001

