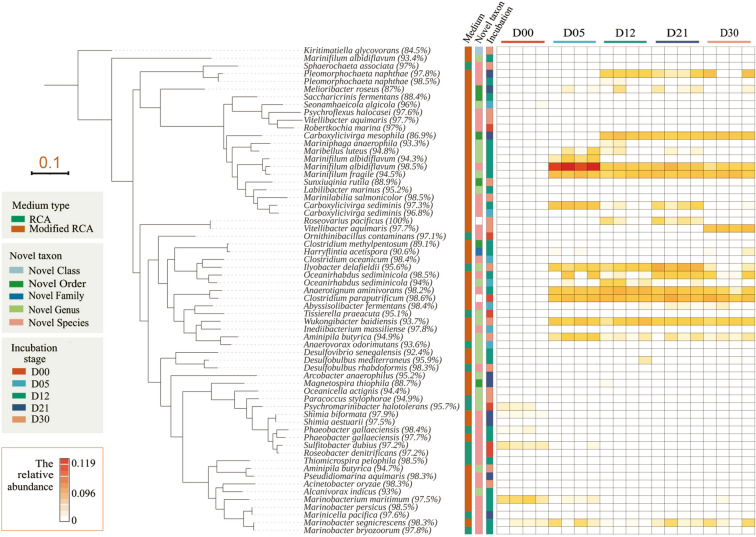
Fig. 5.
Phylogenetic analysis of isolated candidate novel species. The ML phylogenetic tree is displayed in a rectangular layout with a tree scale of 0.1. The first strip on the right of the tree represents the two different media types of isolated strains. The second strip represents the candidate taxon levels. The third strip represents the incubation stages of the isolated strains, and the different incubation stages are randomly coloured. The heatmap represents the relative abundances of isolated strains in the high-throughput sequencing results of the 16S rRNA gene dataset

