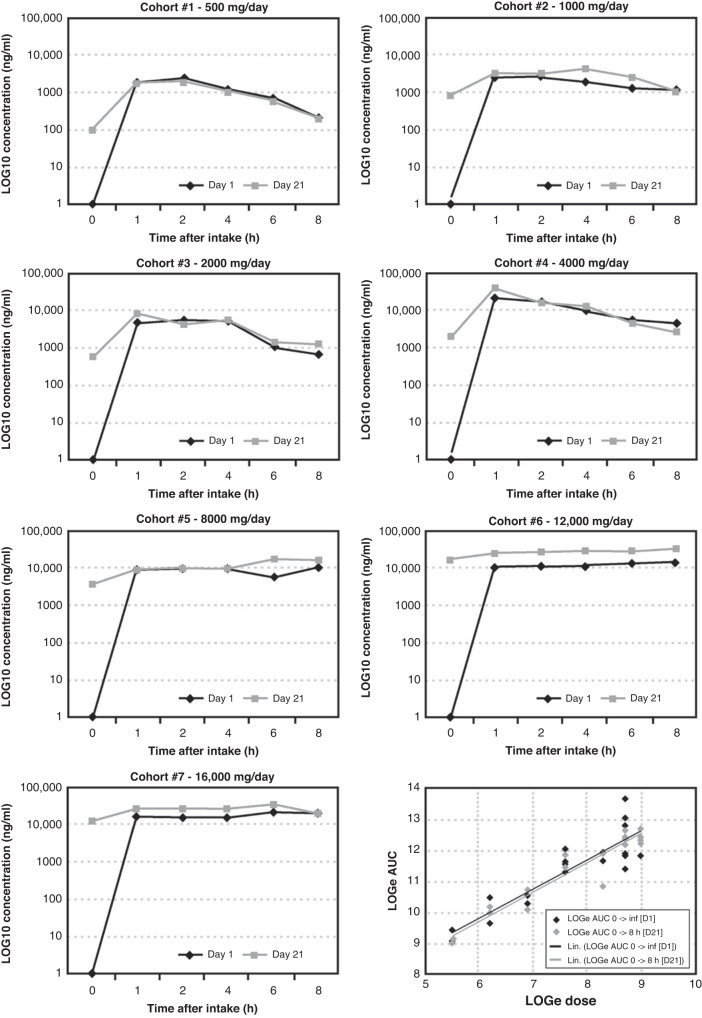
Fig. 2. Pharmacokinetic profiles of 2-OHOA at different doses.
The graphs represent log [2-OHOA] (ng/ml) in serum of patients after single dose (day 1, black) and steady state (day 21, black) at doses ranging from 500 mg/d to 16,000 mg/d (p.o.). Bottom/right panel: Linear relationship between the extent of systemic exposure (area under the curve, AUC) and dose following single (day 1, D1, black) and repeat BID (day 21, D21, grey) administration of 2-OHOA.

