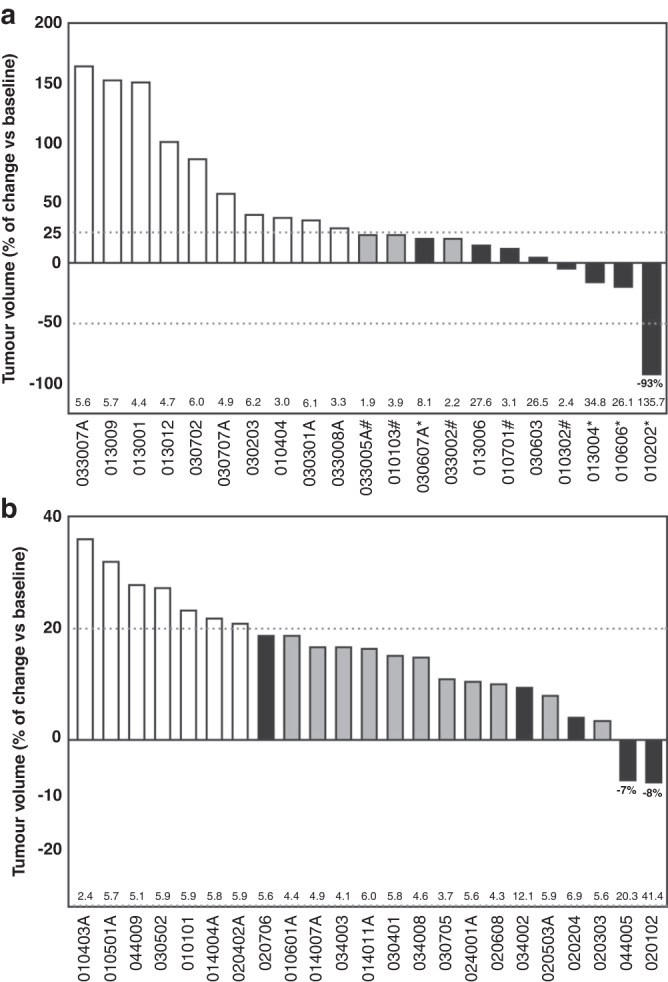
Fig. 3. Waterfall plot responses during 2-OHOA monotherapy.

Best response after initial diagnosis. a tumour volume of patients with glioma with respect to the baseline volume at recruitment (100%). The dotted lines describe the upper and lower limits to consider tumour progression, stable disease, and tumour regression by RANO criteria. b tumour volume in non-glioma patients with respect to the baseline volume (100%). In both graphs, open bars define the tumour volume in non-responding patients, grey bars are patients with stable disease or tumour regression who failed to meet all RANO or RECIST criteria and black bars are patients with stable disease or tumour regression.
