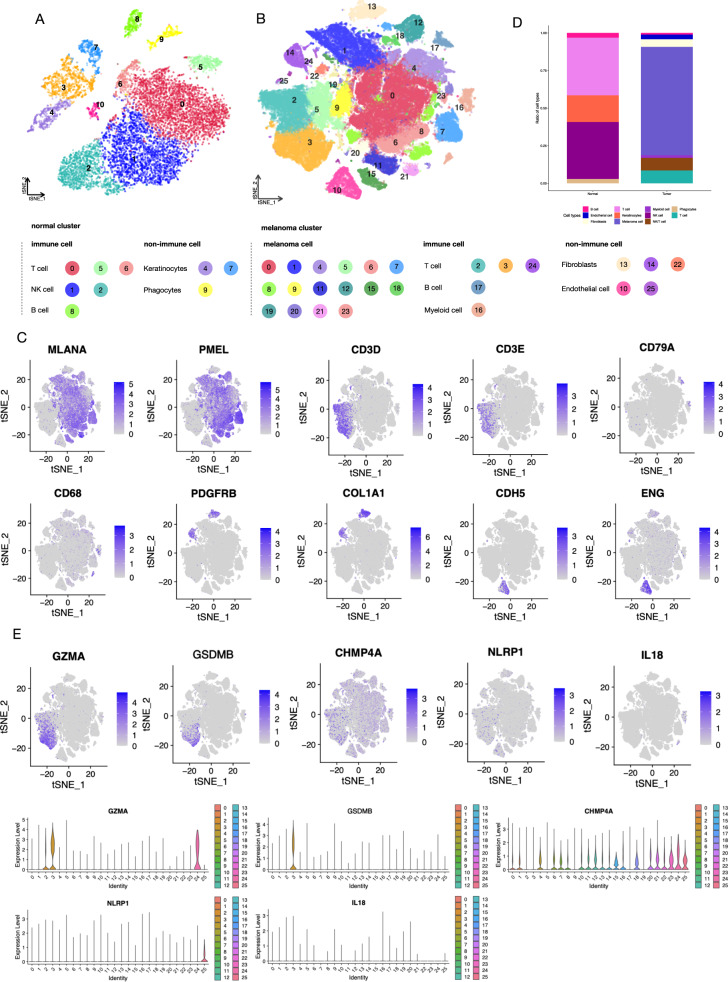
Fig. 3. scRNA-seq profiling of the melanoma environments.
A T-distributed stochastic neighbor embedding (tSNE) plot of control samples, non-immune cells, and immune cells are shown separately. B tSNE plot of melanoma samples, showing the annotation and color code for cell types in the melanoma ecosystem and cell origins by color, non-immune cells, and immune cells are shown separately. C The cell classification basis of melanoma scRNA-seq analysis was displayed with the marker genes expression in the Feature plot. D Histogram indicating the proportion of cells in tumor tissue of each group. E The expression of kernel PRGs in melanoma indicates the origination of immune cells.

