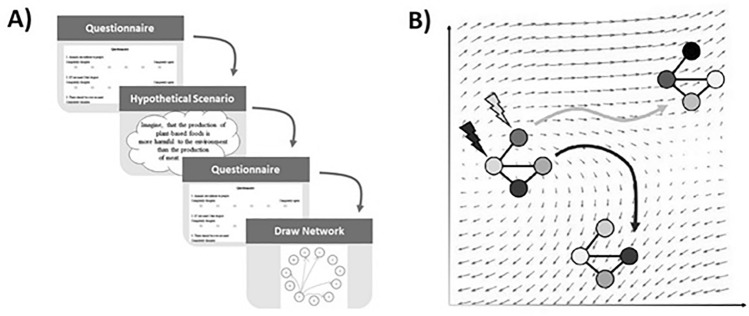
Figure 1.
A schematic view of the data and network control theory approach to quantify and predict the effect of interventions. (A) Thirty participants answered eleven questions about their attitude towards the consumption of meat. Based on their responses, they are asked to contemplate certain scenarios that are designed to alter their opinion. After this “intervention”, the participants are once more asked the same questions and asked to draw a schematic of connections between the items. (B) The effect of interventions in the context of psychological networks can be understood in terms of network control theory. Each network structure dictates the possible transitions of network values (illustrated here in terms of the arrows). The geometry of these arrows relates to the network structure and the dynamic imposed on them and can be linear or nonlinear. Figure 1A adapted from Hoekstra et al35.

