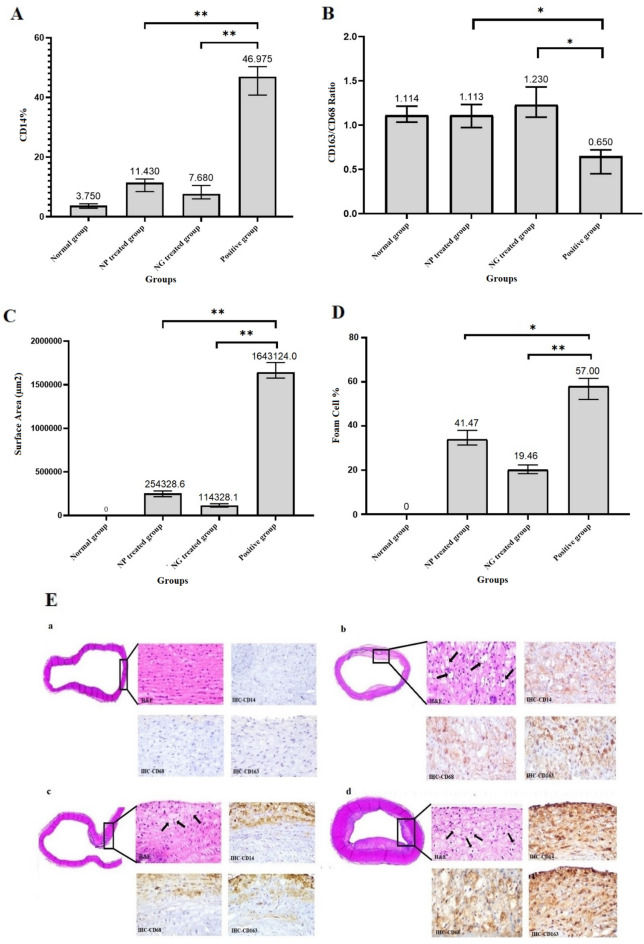
Figure 6.
Semi-quantitative estimation of CD14 + cell percentage (A); CD163:CD68 ratio (B) through histo/immunohistochemistry analysis; Estimation of surface area (µm2) in intimal area of plaques using the Optika software (× 64, 4.11.18081.20201205 (C). Estimation of foam cell percentage (D) for NG/NP treated groups, compared to the normal and the positive group (P-values for all groups versus related positive controls were labeled with * and ** which indicate less than 0.05 and 0.01, respectively; α = 0.05). Data represent mean ± SD (n = 3). Representative hematoxylin–eosin and immuno-histochemical staining (E) for the aorta sections in the rabbit group fed with cholesterol-free feed/negative control (a); NP treated group (b); NG treated group (c) and positive group (d). Black arrows in Eb, Ec and Ed show the location of foam cells. 100 μL of NG and NP containing about 48 ng/mL of Gliclazide was injected into each group (n = 8) daily and every 2 days for 4 weeks, respectively.

