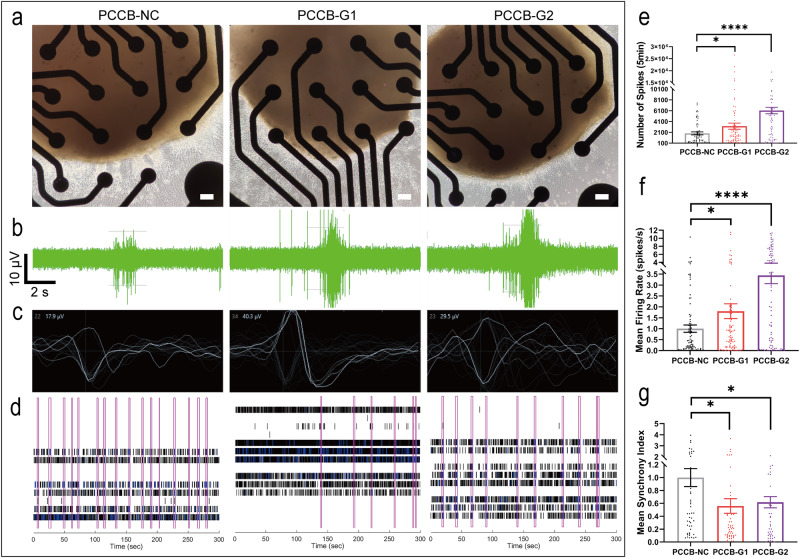
Fig. 5. MEA assay after PCCB knockdown in U2F hFOs.
a Bright field of hFOs cultured in 24-well MEA plate. Scale bar, 100 μm. b Representative burst traces for individual electrode recorded from hFOs. c Schematic diagram of a single unit event. d Raster plot of neural network activity. Each pink box represents a synchronized burst. e–g PCCB knockdown increased the number of spikes (e) and mean neuron firing rate (f) but reduced the synchronized burst index in hFOs (g). N ≥ 13 biologically independent samples in each group. Data are shown as Mean ± SEM. The unpaired two-tailed t-test was used to assess difference between the PCCB-NC and PCCB-G1 or PCCB-G2 group. *P < 0.05, ****P < 0.0001. Source data underlying e-g are provided as a Source Data file.

