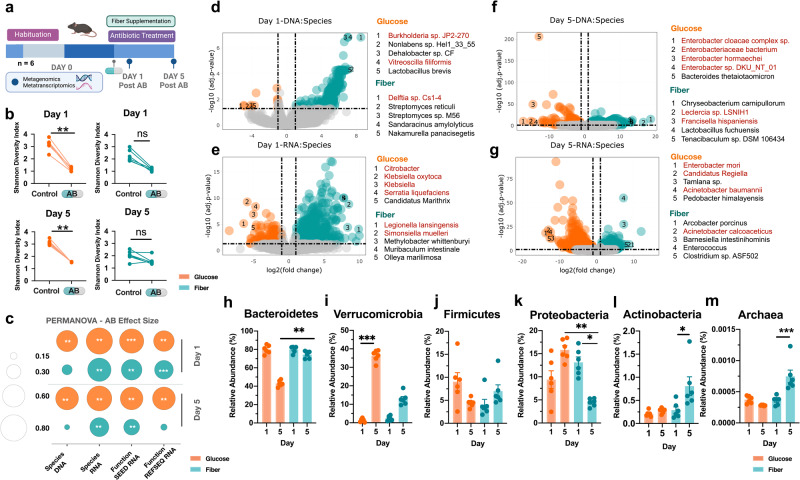
Fig. 2. Fiber supplementation reduces antibiotic-induced drop in diversity and Proteobacteria abundance.
a Mouse experiment schematic (n = 6). b Antibiotic-induced drop in diversity D1 and D5 during experiment in glucose and fiber-supplemented mice (n = 6). Kruskal Wallis with Dunn’s Correction. Day 1 Glucose adj p value = 0.0031. Day 5 Glucose adj p value = 0.0049. c Antibiotic effect size calculated from PERMANOVA analyses of Bray–Curtis distances using the PCoA method from metagenomic and metatranscriptomic data sets (n = 6). Plot displays effect size (size of the dot) with significance from adj p values denoted by significance stars. Full results shown in source data. DESeq2 of significant species associated with each group day 1 and day 5 of experiment from metagenomic (d, f) and metatranscriptomic (e, g) data of antibiotic effect on glucose vs fiber. Proteobacteria species are in red. log2 FC > 1 and p-adj <0.05 (n = 6). Full results available in supplementary information and visualized in Rshiny (https://belenkylab.shinyapps.io/shiny). h Changes in Bacteroides phylum at D1 and D5 of experiment, adj p value = 0.0049. i Verrucomicrobia phylum, adj p value = 0.0004. j Firmicutes phylum k Proteobacteria phylum, Glucose day 5 vs Fiber day 5 adj p value = 0.0014, Fiber day 1 vs Fiber day 5 adj p value = 0.0478. l Actinobacteria phylum, adj p value = 0.0330. m Archaea, adj p value = 0.0002. For h–m (n = 6) Mean ± SEM Kruskal Wallis with Dunn’s Correction *p < 0.05; **p < 0.01; ***p < 0.001; ****p < 0.0001.

