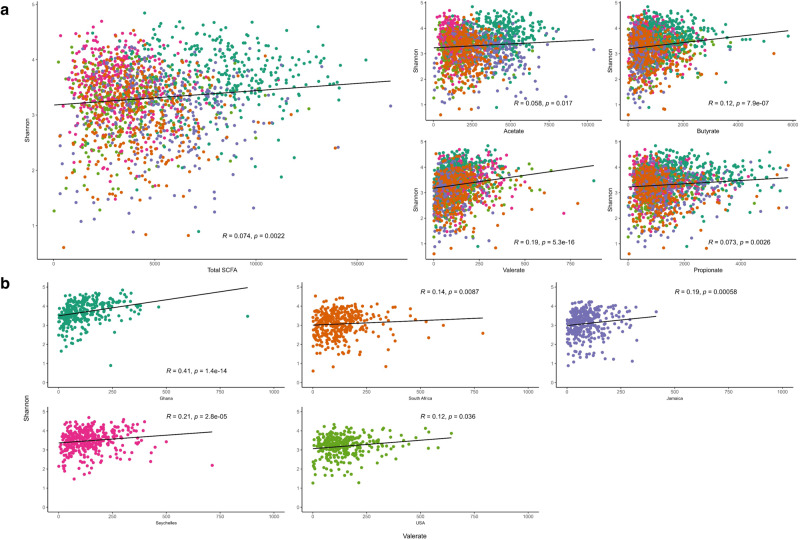
Fig. 4. Shannon index correlates positively with fecal short-chain fatty acids.
a Correlations (Spearman’s rho, R; two-sided) between Shannon diversity and concentrations (n = 1704) of the different types of fecal short-chain fatty acids (SCFAs) among countries. b Country level correlations (Spearman’s rho, R; two-sided) between Shannon and valerate levels in Ghana (n = 331); South Africa (n = 362); Jamaica (n = 331); Seychelles (n = 374); US (n = 306). Each colored dot represents a sample of a specific country, and the horizontal line on the scatterplot denotes the line of best fit. Unadjusted p values are reported. Source data are provided as a Source Data file.

