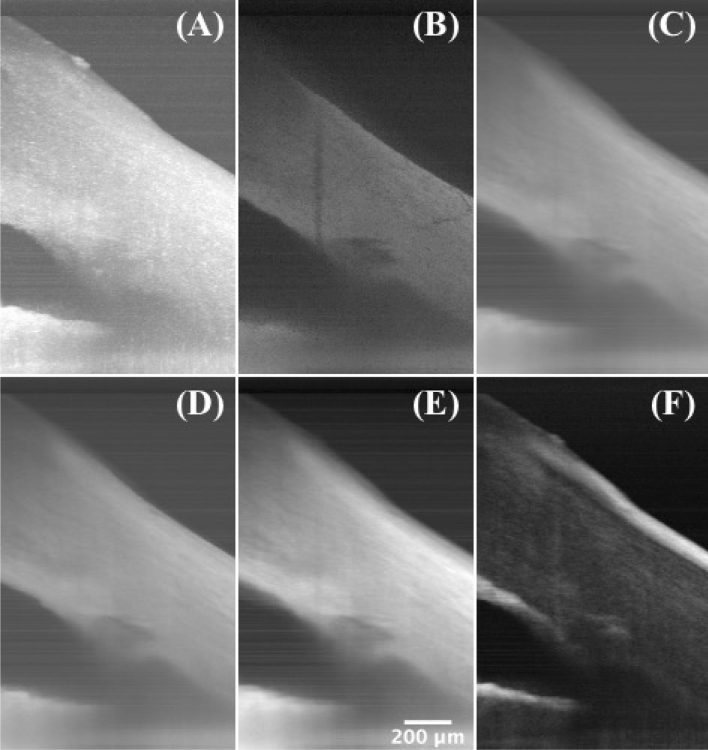
Figure 4.
Intensity projections. (A) Maximum intensity projection, (B) minimum intensity projection, (C) average intensity projection, (D) median intensity projection, (E) sum intensity projection, and (F) standard deviation intensity projection along the y-axis of a 2.5-mm segment of radial scanning at the iridocorneal angle of a human cadaver eye, showing the TM/SC region and the damaged tissue on the surface. Same eye used in Fig. 1.

