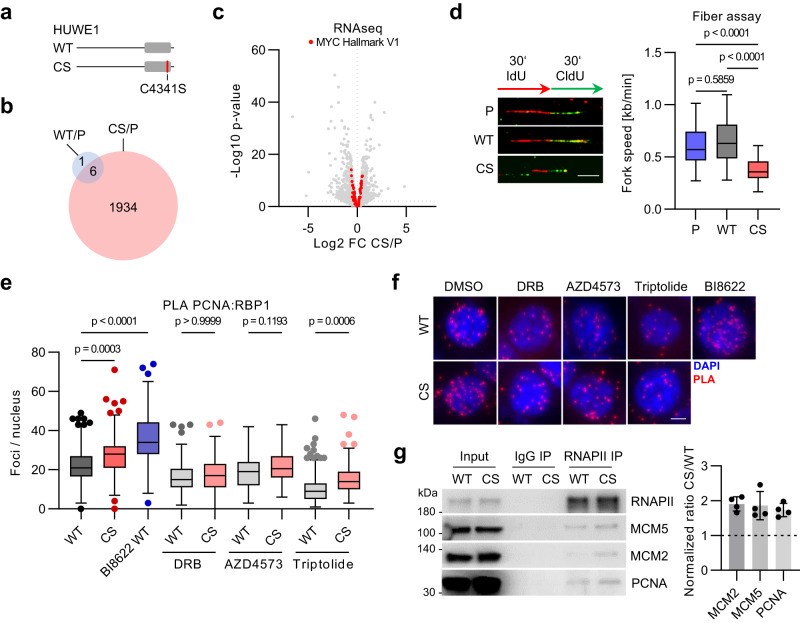
Fig. 1. Mutation of HUWE1 induces transcription-replication conflicts.
a The catalytic cysteine of the endogenous HUWE1 HECT domain (gray) was replaced by a serine (HUWE1-CS, CS) or the wild type cysteine (HUWE1-WT, WT) in parental HCT116 cells (P). b Transcriptome analysis of HUWE1-P, HUWE1-WT and HUWE1-CS cells. Overlap of genes significantly deregulated (p-value ≤ 0.01, FDR ≤ 0.01, n = 3) in HUWE1-WT or HUWE1-CS cells relative to parental HUWE1-P cells. c Volcano plot of RNAseq analysis (n = 11350 transcripts over 3 biological replicates). Members of the MYC hallmark V1 gene set are highlighted in red. d DNA fiber assay in parental HCT116 (P), HUWE1-WT and HUWE1-CS cells. Representative images of single DNA fibers (left) and quantification (right) are shown (n = 50 forks per group). Scale bar: 4 µm; n = 3 experiments e, f Proximity ligation assay (PLA) with antibodies to PCNA and RNAPII in HUWE1-WT and HUWE1-CS cells treated with 100 µM DRB, 10 nM AZD4573, 100 nM triptolide or the HUWE1 inhibitor BI-8622 (5 µM) for 7 h. e Quantification of proximity pairs within nuclei for n = 181,173,154,165,169,147,142,196,152 cells. f Representative images. Scale bar: 5 µm. g Immunoprecipitation (IP) of RNAPII in formaldehyde-crosslinked and sonicated HUWE1-WT and HUWE1-CS cells. A representative image (left) and quantification of the CS/WT ratio (right) are shown (n = 4, mean ± SD). d, e Boxplots show median±quartiles with whiskers ranging up to 1.5-fold of the inter-quartile range. P-values were determined using Kruskal–Wallis test followed by Dunn’s multiple comparison. Source data are provided as a Source Data file.

