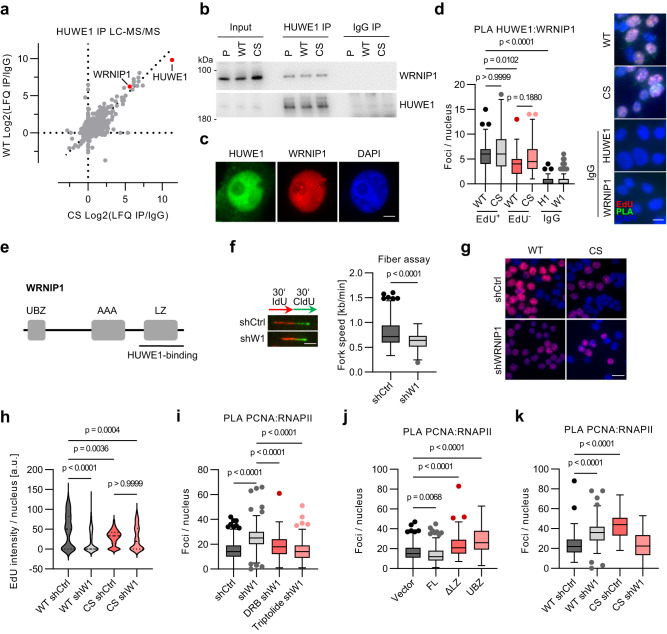
Fig. 2. HUWE1 interacts with WRNIP1.
a LC-MS/MS analysis of HUWE1 immunoprecipitates in HUWE1-WT and HUWE1-CS cells. b Validation of WRNIP1 as an interactor f HUWE1 by immunoprecipitation (IP) and immunoblotting (n = 3). c Immunofluorescence staining of HUWE1 and WRNIP1 in HCT116 cells (n = 3). Scale bar: 5 µm. d PLA assay with HUWE1 and WRNIP1 antibodies in WT and CS cells after pulse-labeling with 25 µM EdU for 30 min. PLA foci were quantified and are displayed for EdU-positive (EdU+) and EdU-negative (EdU−) cell populations and for cells stained solely with either the HUWE1-IgG (H1) or the WRNIP1-IgG (W1). From left, n = 128, 161, 107, 92,199, 214 cells. Scale bar: 10 µm. e Mapping of the WRNIP1 domain required for HUWE1 binding. UBZ: Ubiquitin binding zinc finger; LZ: Leucine zipper; AAA: AAA+ ATPase domain. See also Supplementary Fig. 2e, f. f DNA fiber assay in HCT116 cell expressing either shCtrl or shWRNIP1. Example images (left) and quantification (right) are shown (n = 125 fibers per group). P-values were determined using the non-parametric, two-tailed Mann–Whitney test. Scale bar: 4 µm. g EdU incorporation assay in WT or CS cells expressing shCtrl or shWRNIP1 (shW1). Scale bar: 20 µm, n = 2. h Quantification of the EdU incorporation assay shown in (g). From left, n = 192,165,184,115 cells. i Quantification of RNAPII-PCNA PLA foci in control and WRNIP1-depleted cells treated with 100 µM DRB or 100 nM triptolide for 6 h (≥100 cells per group). j RNAPII-PCNA PLA foci quantification of cells expressing full-length (FL) HA-WRNIP1, WRNIP1 lacking the leucine zipper domain (ΔLZ) or only the WRNIP1 UBZ domain (UBZ). See also Supplementary Fig. 2f. From left, n = 190,185,176,179 cells. k Quantification of RNAPII-PCNA PLA in HUWE1-WT and HUWE1-CS cells, expressing shCtrl or shWRNIP1. From left, n = 177,140,137,132 cells. d, h–k Boxplots show median±quartiles with whiskers ranging up to 1.5-fold of the inter-quartile range. P-values were determined using Kruskal–Wallis test followed by Dunn’s multiple comparison. Source data are provided as a Source Data file.

