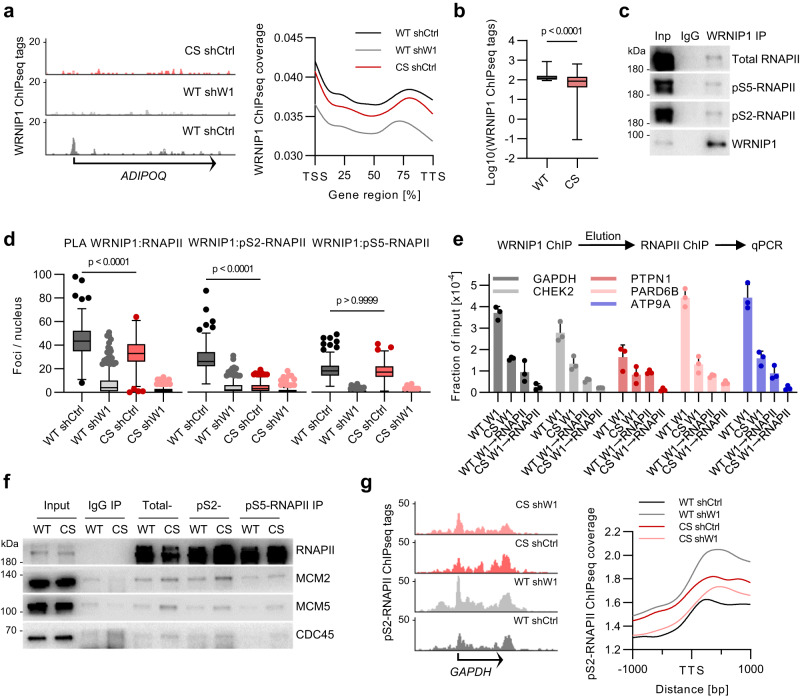
Fig. 3. HUWE1 controls association of WRNIP1 with elongating RNAPII.
a Representative genome browser tracks (left) and quantification (right) of WRNIP1 ChIPseq experiments. WRNIP1 ChIPseq tags were quantified at genic regions of all genes and displayed as scaled metagenes. b WRNIP1 ChIPseq normalized tag counts for the top 1000 WRNIP1-bound genes in HUWE1-WT cells compared with HUWE1-CS cells (n = 1000 genes). Boxplots represent median±quartiles with whiskers ranging from minimum to maximum values. Significance was determined using a paired, two-tailed t test. c Immunoprecipitation (IP) analysis with WRNIP1 in benzonase-treated HCT116 lysates (n = 3). d PLA with antibodies to WRNIP1 and RNAPII (n = 202, 221, 230, 182 cells), pS2-RNAPII (n = 179, 216, 232, 207 cells) and pS5-RNAPII (n = 181, 202, 252, 182 cells) in HUWE1-WT and HUWE1-CS cells expressing shWRNIP1 (shW1) or a shCtrl. Boxplots show median±quartiles with whiskers ranging up to 1.5-fold of the inter-quartile range. P-values were determined using Kruskal-Wallis test followed by Dunn’s multiple comparison. e Re-ChIP experiment consisting of a first ChIP with WRNIP1 antibodies followed by elution of protein-DNA complexes and a second ChIP with RNAPII antibodies. Purified DNA was analyzed by qPCR with the indicated primer pairs (n = 3, mean ± SD). f Immunoprecipitation of total, pS2-, or pS5-RNAPII in formaldehyde-crosslinked WT and CS cells (n = 2). g ChIPseq analysis of pS2-RNAPII in the indicated cell lines. Representative genome browser tracks (left) and quantification of pS2-RNAPII ChIPseq tag coverage at all transcription termination sites (right). Source data are provided as a Source Data file.

