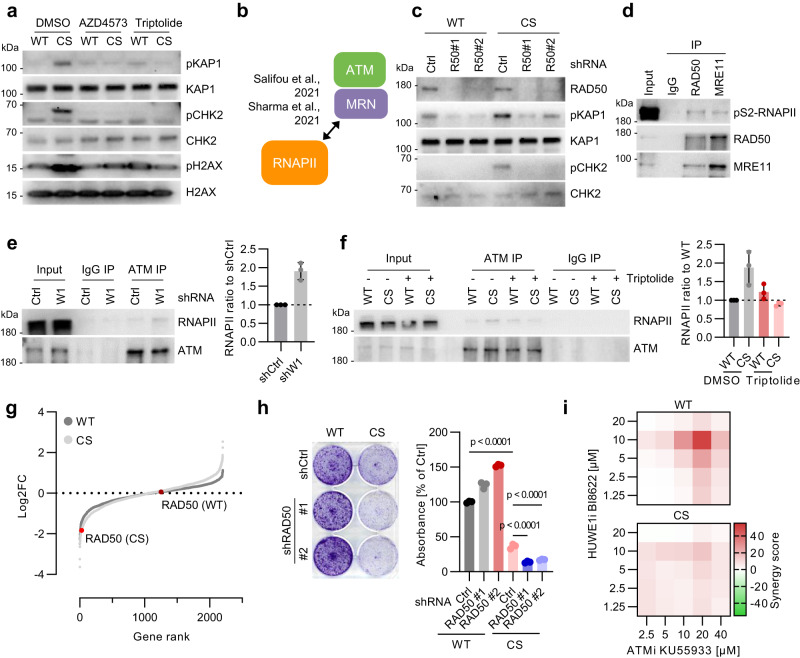
Fig. 5. HUWE1 and WRNIP1 limit ATM activation at RNAPII.
a Immunoblotting analysis of HUWE1-WT and HUWE1-CS cells treated with 20 nM AZD4573 or 20 nM triptolide for 6 h (n = 4). b Scheme of RNAPII-MRN-ATM interaction. See also Supplementary Fig. 5c. c Immunoblot analysis of HUWE1-WT and HUWE1-CS cells expressing shCtrl or shRAD50 (n = 3). d Immunoprecipitation (IP) of RAD50 and MRE11 in benzonase-treated lysates of HCT116 cells (n = 2). e Immunoprecipitation of ATM in benzonase-treated lysates of shWRNIP1 or shCtrl cells. A representative image (left) and densitometry-based quantification (right, n = 3, mean ± SD) are shown. f Immunoprecipitation of ATM in benzonase-treated lysates using HUWE1-WT and HUWE1-CS cells treated with DMSO (−) or 20 nM triptolide (+) for 4 h. A representative image (left) and densitometry-based quantification (right, n = 3, mean ± SD) are shown. g CRISPR-KO screen using a focused sgRNA library targeting genes within GO terms “Cell cycle”, “DNA replication” and “DNA repair” in HUWE1-WT and HUWE1-CS cells. h Crystal violet staining (left) and quantification (right, n = 3, mean ± SD) of HUWE1-WT or HUWE1-CS cells expressing shRAD50 or shCtrl after 7 days of unperturbed growth. P-values were determined with one-way ANOVA followed by Tukey’s multiple comparison. i Synergy of ATM and HUWE1 inhibitors in killing of HUWE1-WT and HUWE1-CS cells determined by WST-8 assay after 4 d of treatment. Source data are provided as a Source Data file.

