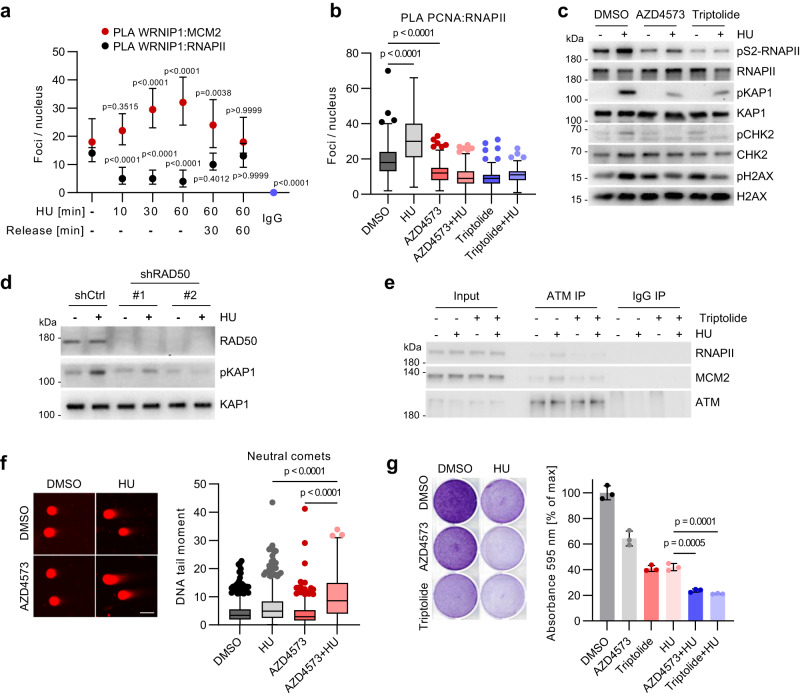
Fig. 6. HUWE1 and WRNIP1 control RNAPII-dependent ATM activation upon replicative stress.
a PLA with antibodies against WRNIP1 and MCM2 (n = 190, 167, 132, 140, 175, 172, 207 cells) or WRNIP1 and RNAPII (n = 171, 145, 130, 140, 137, 161, 207 cells) in HCT116 cells treated with 1 mM hydroxyurea (HU) or released from HU for the indicated time. The graph shows median±quartiles for counts of proximity pairs in nuclei. P-values were determined using Kruskal–Wallis test followed by Dunn’s multiple comparison. Displayed p-values correspond to the comparison of the respective sample to the non-treatment control. b PLA with antibodies to PCNA and RNAPII in cells with 2 h pre-treatment using 20 nM AZD4573 or 100 nM triptolide followed by the addition of 1 mM HU for 4 h (n = 187, 160, 195, 223, 198, 171 cells). c Immunoblot analysis of HCT116 cells treated with 1 mM HU for 4 h or in combination with 2 h pre-treatment using 20 nM AZD4573 or 100 nM triptolide (n = 3). d Immunoblot analysis of HCT cells expressing shCtrl or shRAD50 after treatment with 1 mM HU for 2 h (n = 2). e Immunoprecipitation (IP) of ATM in cells treated with 1 mM hydroxyurea or in combination with 20 nM triptolide for 4 h (n = 2). f Neutral comet assay in HCT116 cells treated with DMSO, 1 mM HU alone or in combination with 20 nM AZD4573 for 6 h, followed by a 24 h release phase. Scale bar: 50 µm. From left, n = 585, 517, 376, 320 cells. g Crystal violet staining of HCT116 cells treated with 1 nM AZD4573 or 2.5 nM triptolide for 3 h followed by addition of 250 µM hydroxyurea (HU) for 4 days. P-values were determined using one-way ANOVA followed by Tukey’s multiple comparison. b, f Boxplots show median±quartiles with whiskers ranging up to 1.5-fold of the inter-quartile range. P-values were determined using Kruskal–Wallis test followed by Dunn’s multiple comparison. Source data are provided as a Source Data file.

