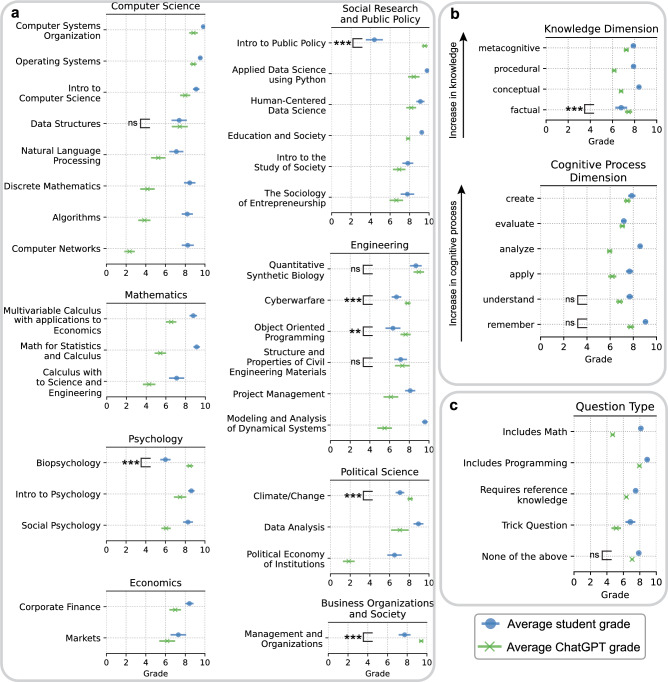
Figure 1.
Comparing ChatGPT to university-level students. Comparing ChatGPT’s average grade (green) to the students’ average grade (blue), with error bars representing 95% confidence intervals. (a) Comparison across university courses. (b) Comparison across the “cognitive process” and “knowledge” dimensions of Anderson and Krathwohl taxonomy’s of learning. (c) Comparison across question types. p-values are calculated using bootstrapped two-sided Welch’s T-test, and only shown for courses where GPT does not receive a significantly lower grade compared to students (** = ; *** = ; not significant, i.e., ).

