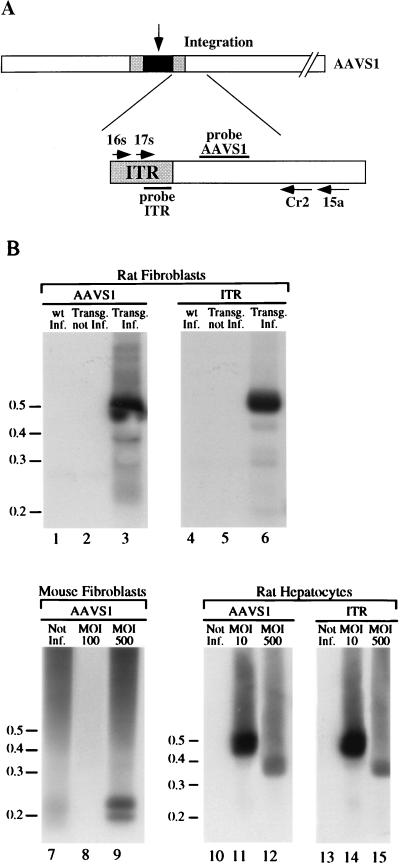
FIG. 2.
PCR amplification of ITR-AAVS1 junctions. (A) Schematic representation of the components of the PCR assay. AAV genome integrated at the AAVS1 is represented by dark box. The gray boxes indicate the AAV ITRs. The open box indicates the AAVS1. The primers used in the PCR analysis are indicated by arrows and are labeled with the associated numbers. Primers 16s and 17s are derived from the AAV ITR. Primers 15a and Cr2 are derived from AAVS1 (34). (B) Site-specific integration of wt AAV genome in transgenic rat and mouse fibroblasts. Rat wt (lanes 1 and 4) and transgenic (lanes 3 and 6) fibroblasts were infected with wt AAV virus at an MOI of 100. Mouse transgenic embryonic fibroblasts were infected with wt AAV at MOIs of 100 (lane 8) and 500 (lane 9). Transgenic rat primary hepatocytes were infected with wt AAV at MOIs of 10 (lanes 11 and 14) and 500 (lanes 12 and 15). Two days postinfection, genomic DNA was prepared and subjected to nested set PCR amplification with AAV-derived and AAVS1-derived primers. As a control, high-molecular-weight DNA from mock-infected rat (lanes 2 and 5) and mouse transgenic embryonic fibroblasts (lane 7) and from rat primary hepatocytes (lanes 10 and 13) were also subjected to the PCR amplification protocol. The products were run on an agarose gel, transferred to nylon membrane, and sequentially hybridized to AAVS1 (lanes 1 to 3 and lanes 7 to 12)- and AAV-specific probes (lanes 4 to 6 and lanes 13 to 15) as described earlier (34). The positions of the molecular-weight standards (in kilobases) are indicated.

