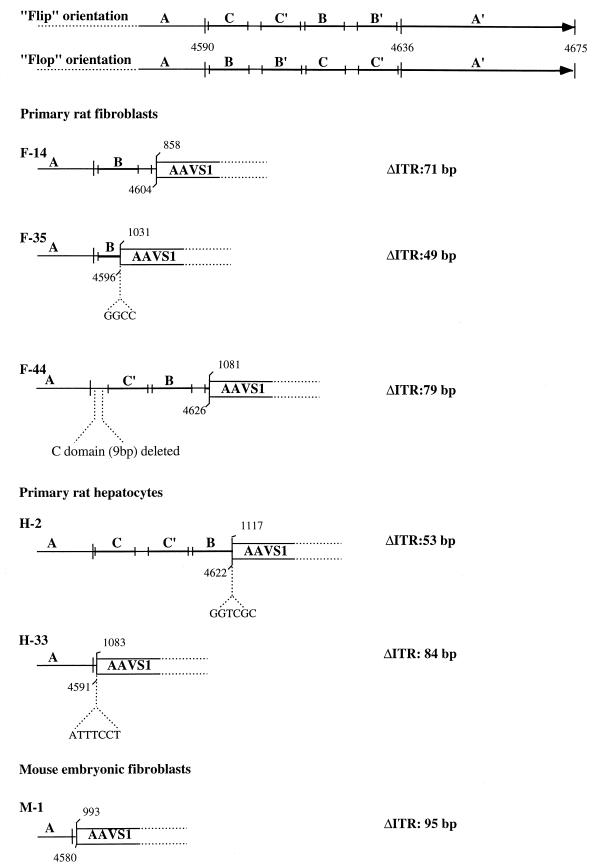
FIG. 3.
Analysis of PCR-amplified AAV-AAVS1 junctions. Amplified junctions from infected primary fibroblasts (F-14, F-44, and F-35) and hepatocytes (H-2 and H-33) of transgenic rats and from embryonic mouse fibroblasts (M-1) were sequenced and compared with the AAVS1 sequence. The ITR sequence is indicated with the nucleotide numbering for the right terminal repeat. Palindromic sequences within the ITR are indicated by the lettering A, C, C′, B, B′, and A, and the two possible orientations Flip and Flop are indicated (39). For each ITR-AAVS1 crossover sequence analyzed, the amount of viral sequence is indicated by the letters representing the ITR palindromic sequences. The numbers above indicate the nucleotide position on the last identifiable viral and AAVS1 sequence. In smaller letters the amplified sequences that cannot be directly associated with either the ITR or the AAVS1 are shown. The number of deleted bases in each ITR analyzed is indicated at the right.

