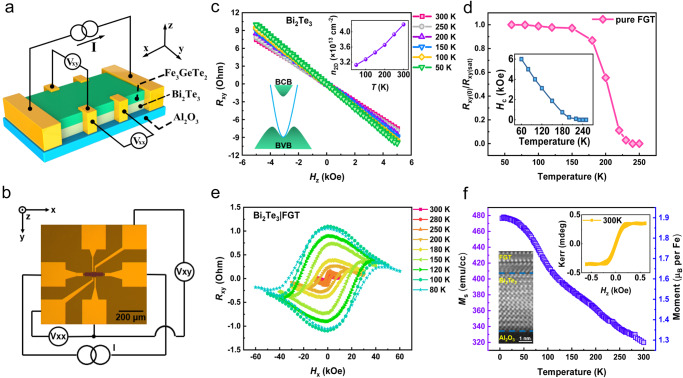
Fig. 1. Electrical and magnetic measurements in Bi2Te3, Fe3GeTe2, and Bi2Te3/Fe3GeTe2.
a Schematic diagram of the device measurement setup. b Optical micrograph of a Hall bar device for electric measurement. c Rxy–Hz curves at different temperatures in 8 nm Bi2Te3. The left inset shows the schematic of the band structure, and the right inset shows the temperature-dependent carrier density. d Normalized remnant anomalous Hall resistance and coercivity as a function of temperature in pure FGT, which displays the Curie temperature is ~220 K. e Rxy as a function of in-plane field Hx at different temperatures in Bi2Te3(8)/FGT(3) heterostructure, which displays the perpendicular magnetic anisotropy. f Curves of saturation magnetization Ms at different temperatures in Bi2Te3/FGT heterostructure. The right inset displays the Kerr signal of the heterostructure at 300 K, and the left inset displays the crystalline quality by HAADF-STEM image.

