Fig. 2.
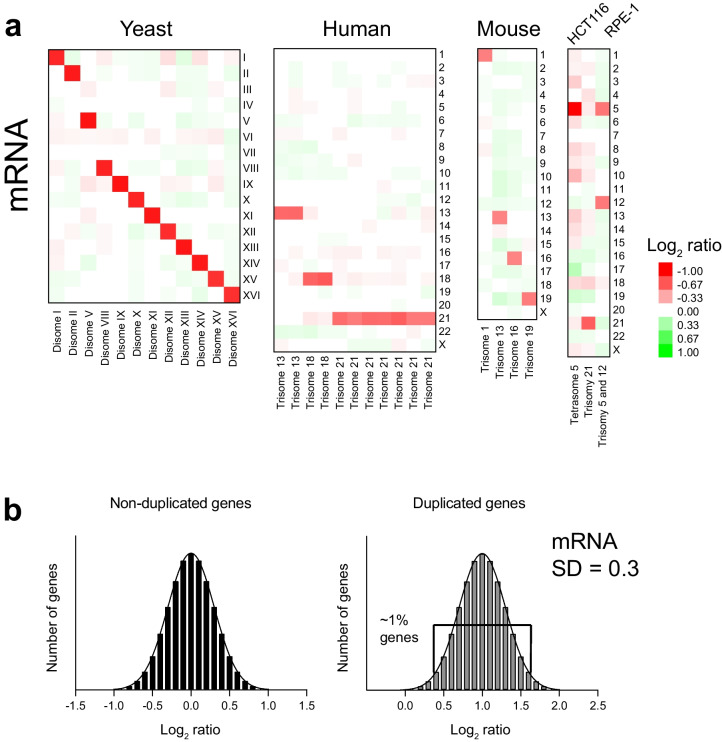
Transcript levels increase proportionally to gene copy number in aneuploid cells. a Heat map of the average log2 ratio of gene expression per chromosome in aneuploid cells relative to controls. Yeast expression data was obtained from Torres et al. (Torres et al. 2007), human trisomies from Hwang et al. (Hwang et al. 2021), mouse trisomies from Williams et al. (Williams et al. 2008), and human cell lines from Stingele et al. (Stingele et al. 2012). b Histograms of the log2 ratios of gene expression of non-duplicated (left, mean = 0) and duplicated genes (right, mean = 1) with a standard deviation (SD) of 0.3 as measured in aneuploid yeast strains. Plots indicate that only a handful of genes, 1.45%, fall outside 2 * SD from the mean (p < 0.05). If a particular gene shows a log2 ratio lower than the expected value of 1 but higher than 0.4, it cannot be considered as dosage compensated because it falls within the expected variability of population measurements with a p value higher than 0.05

