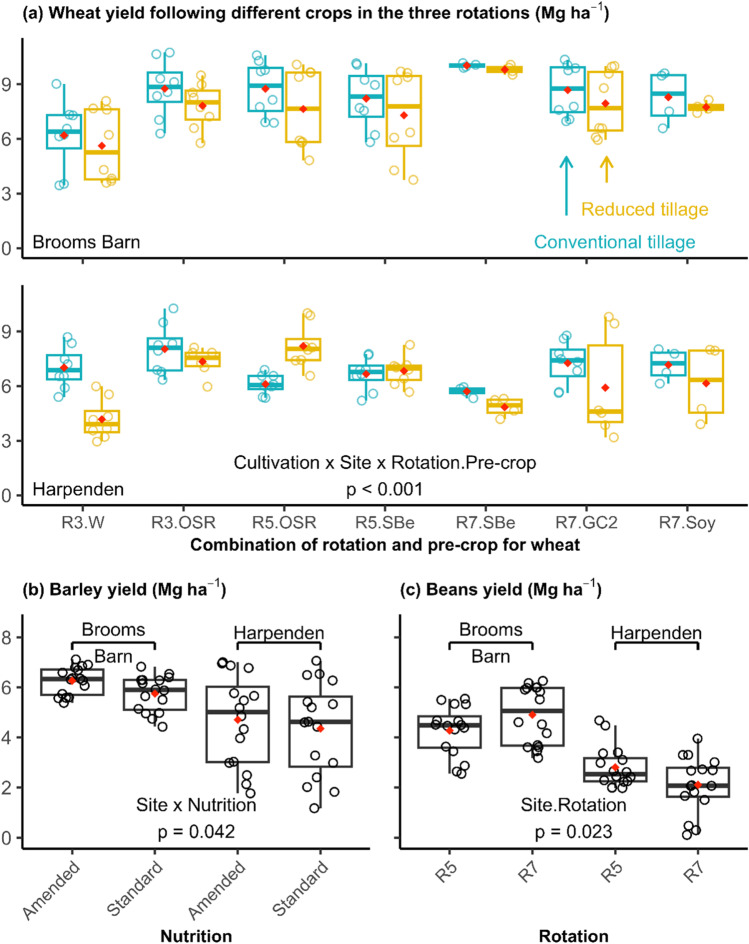
Fig. 7.
Yield of wheat (a), barley (b) and beans (c) at both sites in 2020–2021. Only the significant interaction of the highest order is displayed on the graph (For details see Table 4). The x-axis displays the combination of rotation and previous-crop (Rotation.Pre-crop) for wheat on (a), the nutrition factor (additional organic amendment vs standard fertilization) for barley on (b) and the rotation factor for beans on (c). R3, R5 and R7 indicated the 3-, 5- and 7-year rotations, respectively. W wheat, OSR winter oil seed rape, SBe spring beans, GC2 the 2nd year grass/clover ley, Soy soybean. Mean values are indicated by diamond points. The lower and upper hinges correspond to the 25th and 75th percentiles, and the whiskers extend from the hinge to the largest or smallest value but no further than 1.5 times of the inter-quartile range from the hinge.

