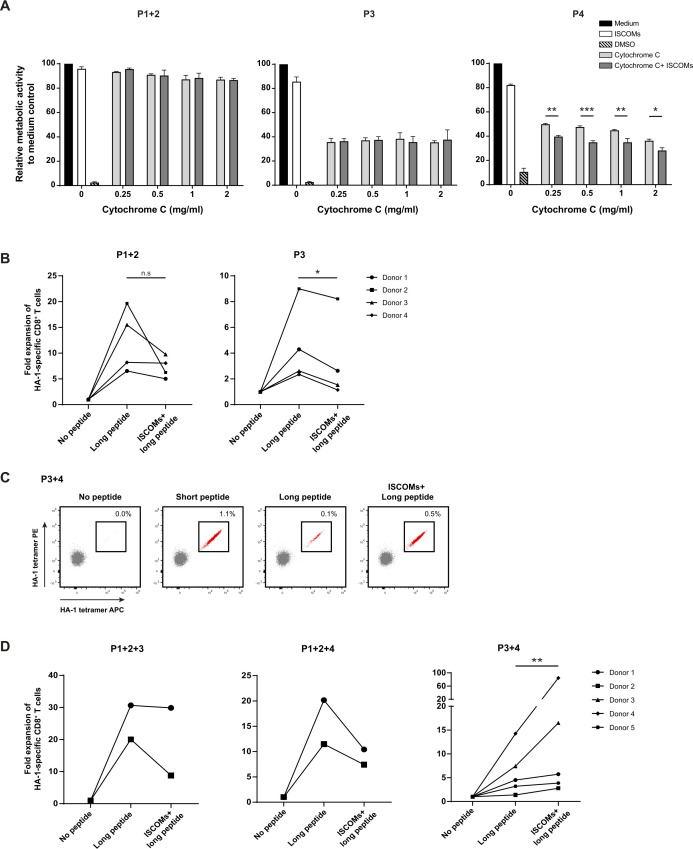
Figure 7.
Enhanced antigen translocation and cross-presentation by CD14+ CD163+ cDC2 s upon ISCOMs. (A) Antigen translocation measured by CCK8 assay after stimulation with ISCOMs and titration of cytochrome c, indicated as relative metabolic activity and viability to medium control. Statistical analyses were done comparing using one-way ANOVA using post hoc Tukey. Representative data from one donor with two technical replicates are shown for two healthy donors. *p<0.05, **p<0.01, ***p<0.001 (DF=10; F (10, 11) = 444.0). (B) Fold expansion of HA-1-specific CD8+ T cells in P1+2 and P3. P1+2 (25,000+25,000 cells) and P3 (50,000 cells) were incubated with PBMCs (500,000 cells) in a 1:10 ratio. Data are shown for four healthy DC donors. (C) HA-1-specific CD8+ T-cell expansion indicated by double-positive HA-1 tetramer staining (in red) for P3+4 (87,000+12,500 cells) after stimulation with short peptide, long peptide, or ISCOMS+long peptide. DCs (100,000 cells) were incubated with PBMCs (1×10⁶ cells) in a 1:10 ratio. Representative flow cytometry data are shown from one healthy DC donor. (D) Fold expansion of HA-1-specific CD8+ T cells in different combinations of cDC2 subsets for the number of donors indicated per graph. P1+2 (12,500+12,500 cells, respectively), P3 (25,000 cells), and P4 (25,000 cells) were combined into P1+2+3, and P1+2+4 (50,000 cells total). For P3+4 the following amounts were used: Donor 1 and 2 (P3 25,000+P4 25,000), donor 3 (P3 75,000+P4 25,000 cells), donor 4 (P3 87,000+P4 12,500 cells), and donor 5 (P3 93,750+P4 6,250 cells). The DCs were incubated with PBMCs containing HA-1-specific CD8+ T cells in a 1:10 ratio. Statistical analyses were done using paired non-parametric t-test. N.s. non significant, *p<0.05, **p<0.01. ANOVA, analysis of variance; DCs, dendritic cells; DMSO, dimethyl sulfoxide; ISCOMs, immune stimulatory complexes; PBMCs, peripheral blood mononuclear cells.

