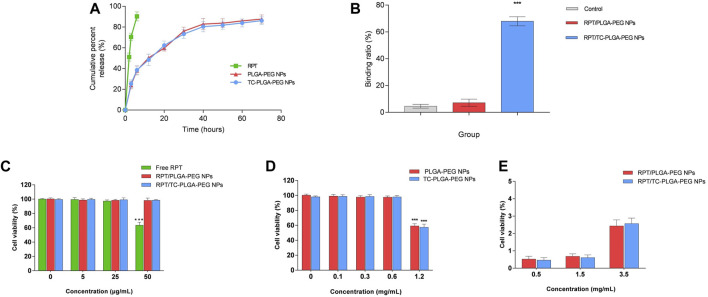
FIGURE 6.
(A) In vitro cumulative release curves of free RPT, RPT/PLGA–PEG NPs and RPT/TC–PLGA–PEG NPs. (B) Bone mineral binding ability. (C) Cytotoxicity studies of drug loaded NPs on rabbit bone marrow mesenchyml stem cell. Note: ***p < 0.001 compared with the negative control. (D) Cytotoxicity studies of blank NPs on rabbit bone marrow mesenchyml stem cell. Note: ***p < 0.001 compared with the negative control. (E) Haemolytic toxicity of various concentrations of NPs.

