Figure 2.
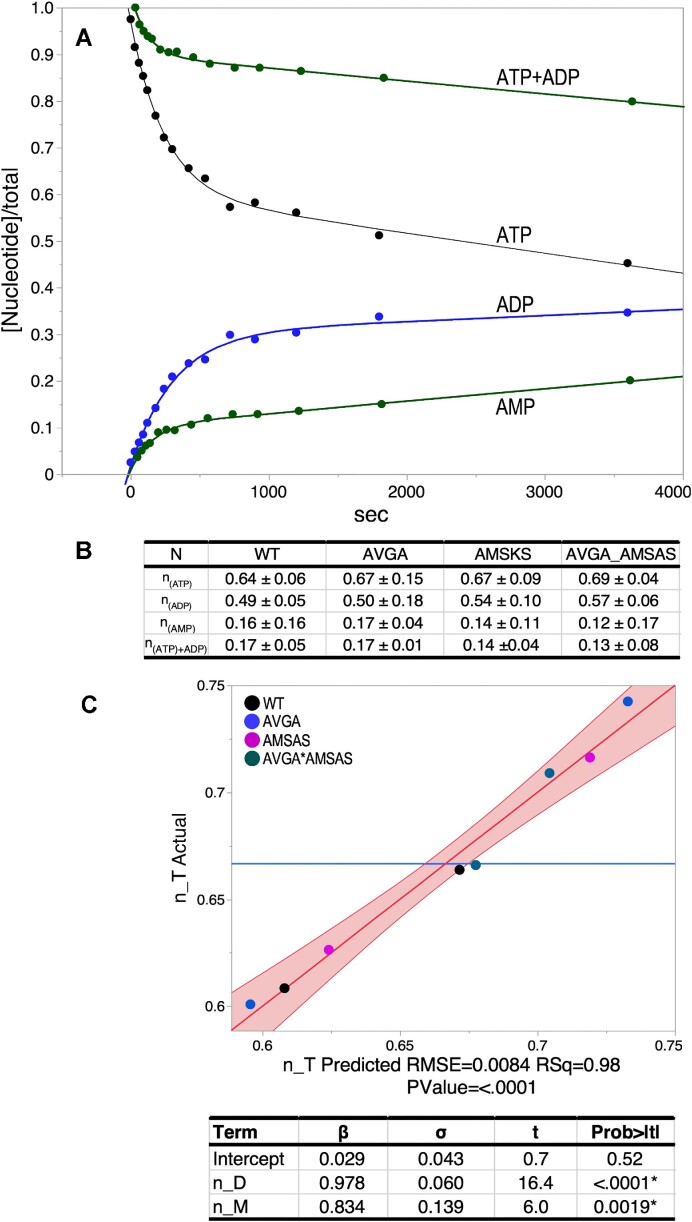
N-value determination for the four LeuAC variants. (A) Single turnover time courses for the three adenine nucleotides. The green ATP + ADP curve represents the ATP consumption after accounting for ADP production and is almost a reflection of the (green) curve for AMP production. Thus, it likely represents in situ formation of leu-5′AMP. (B) Averaged n-values determined from the two physical constants, A (the amplitude of the burst) and C (the offset), with their standard deviations obtained for each variant by fitting to Eq. (1) as described in Materials and Methods. (C) Multivariate regression analysis of n-values averaged in B confirm that n-values for the appearance of ADP and AMP account almost exactly for ATP consumption. Solving the simultaneous equations [n_Ti = Σi,variants (βD(C + n_D) + βM(n_M) + ϵ)] by least squares using JMP16PRO gave the table of values underneath the graph. Here, and elsewhere, the true value of the regression line has a 95% chance of falling within the red boundaries.

