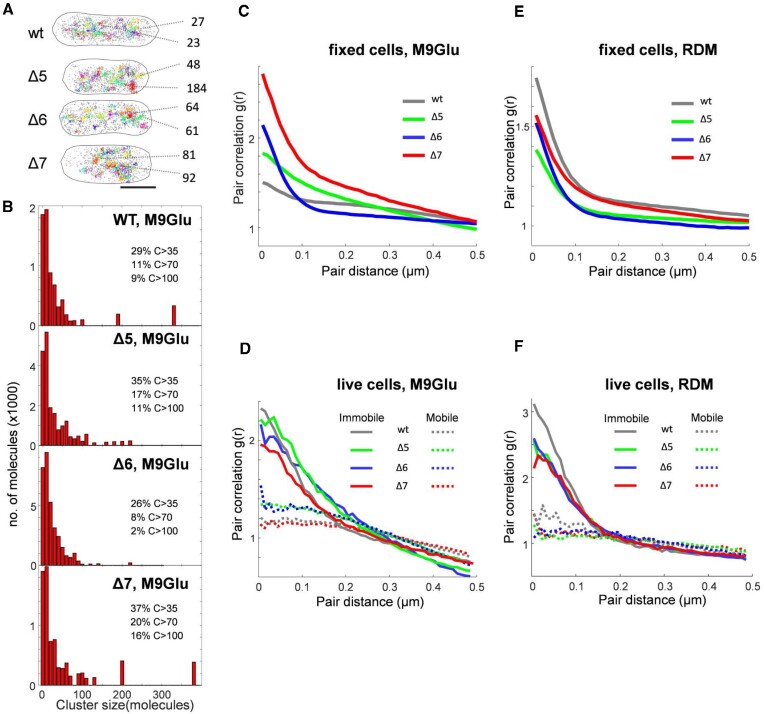
Figure 4.
RNAP clustering and pair correlation analysis of RNAP localizations in M9Glu and rich media. (A) Representative examples of RNAP clusters in single fixed cells for the WT and two Δrrn strains. RNAP clusters are displayed in different colours; non-clustered localizations are displayed as isolated grey points. Scale bar, 1 μm. Two clusters from each cell along with the cluster size (number of molecules) are shown as examples. (B) Histograms of cluster size of RNAPs in fixed cells in M9Glu medium. The fractions of large clusters of different size are listed alongside. (C–F) Pair correlation analysis of RNAP localizations in fixed and live cells of WT and Δrrn strains in M9Glu and RDM. (C) Analysis in fixed cells of all strains in M9Glu. (D) Analysis of immobile and mobile RNAP tracks in live cells for all strains in M9Glu. (E) Analysis of RNAP localizations in fixed cells for all strains in RDM. (F) Analysis of immobile and mobile RNAP tracks in live cells for all strains in RDM.

