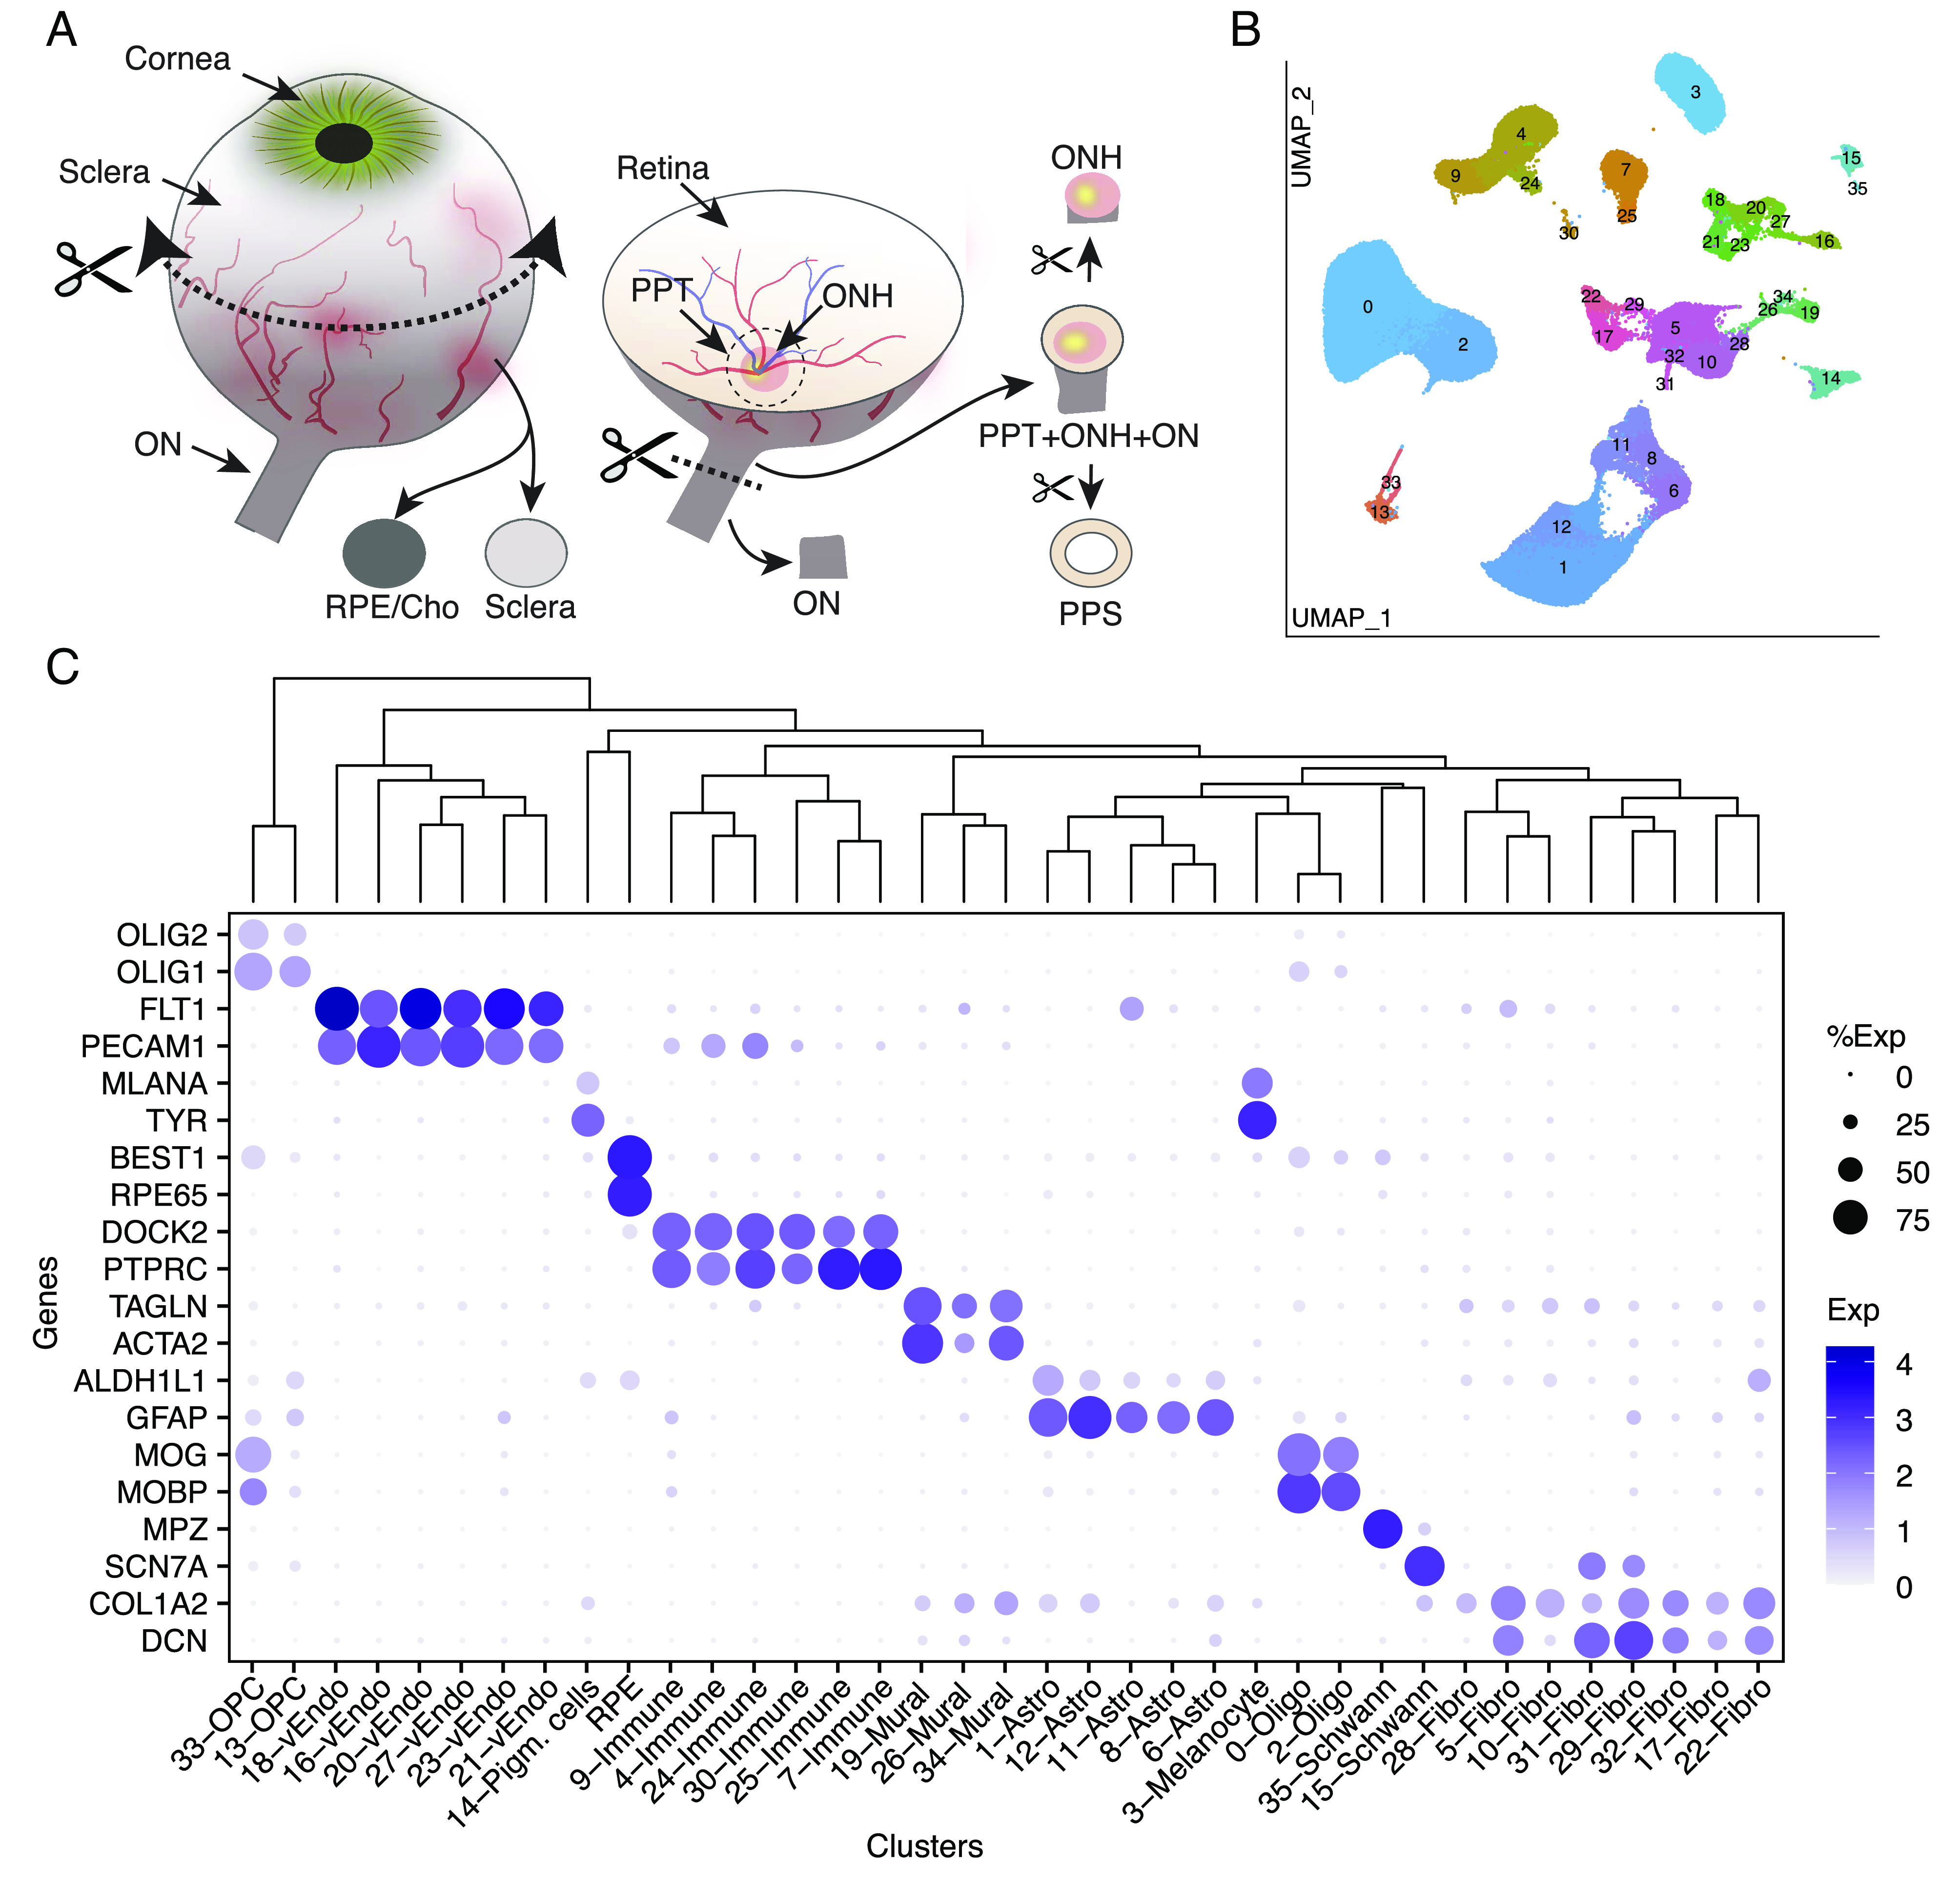
Fig. 2.

Collection of tissues from the posterior segment and initial transcriptomic analysis. (A) Schematic showing how tissues were dissected. Circumferential incision at the pars plana separated anterior and posterior segments, and tissues were dissected from the posterior segment using fine scissors and trephine tissue punches. (B) Clustering of single-nucleus expression profiles from all tissues visualized by UMAP. Each tissue was processed separately. RPE and cells from neural retina were removed before the remaining ~140 k nuclei were pooled together to generate the UMAP. (C) Dot plot showing genes selectively expressed by each cell type. In this and subsequent figures, the size of each circle is proportional to the percentage of nuclei within a cluster expressing the gene, and the color intensity depicts the average normalized transcript count in expressing cells. The dendrogram above the graph shows transcriptional relationships among cell types. ON, optic nerve; ONH, optic nerve head; PPT, peripapillary tissues; PPS, peripapillary sclera; RPE, retinal pigment epithelium; Cho, choroid; Oligo, oligodendrocytes; Endo, vascular endothelium; OPC, oligodendrocyte progenitor cell.
